
Monad Testnet Is Building a Deeper Validator Field Ahead of the Next Expansion Phase
Overview
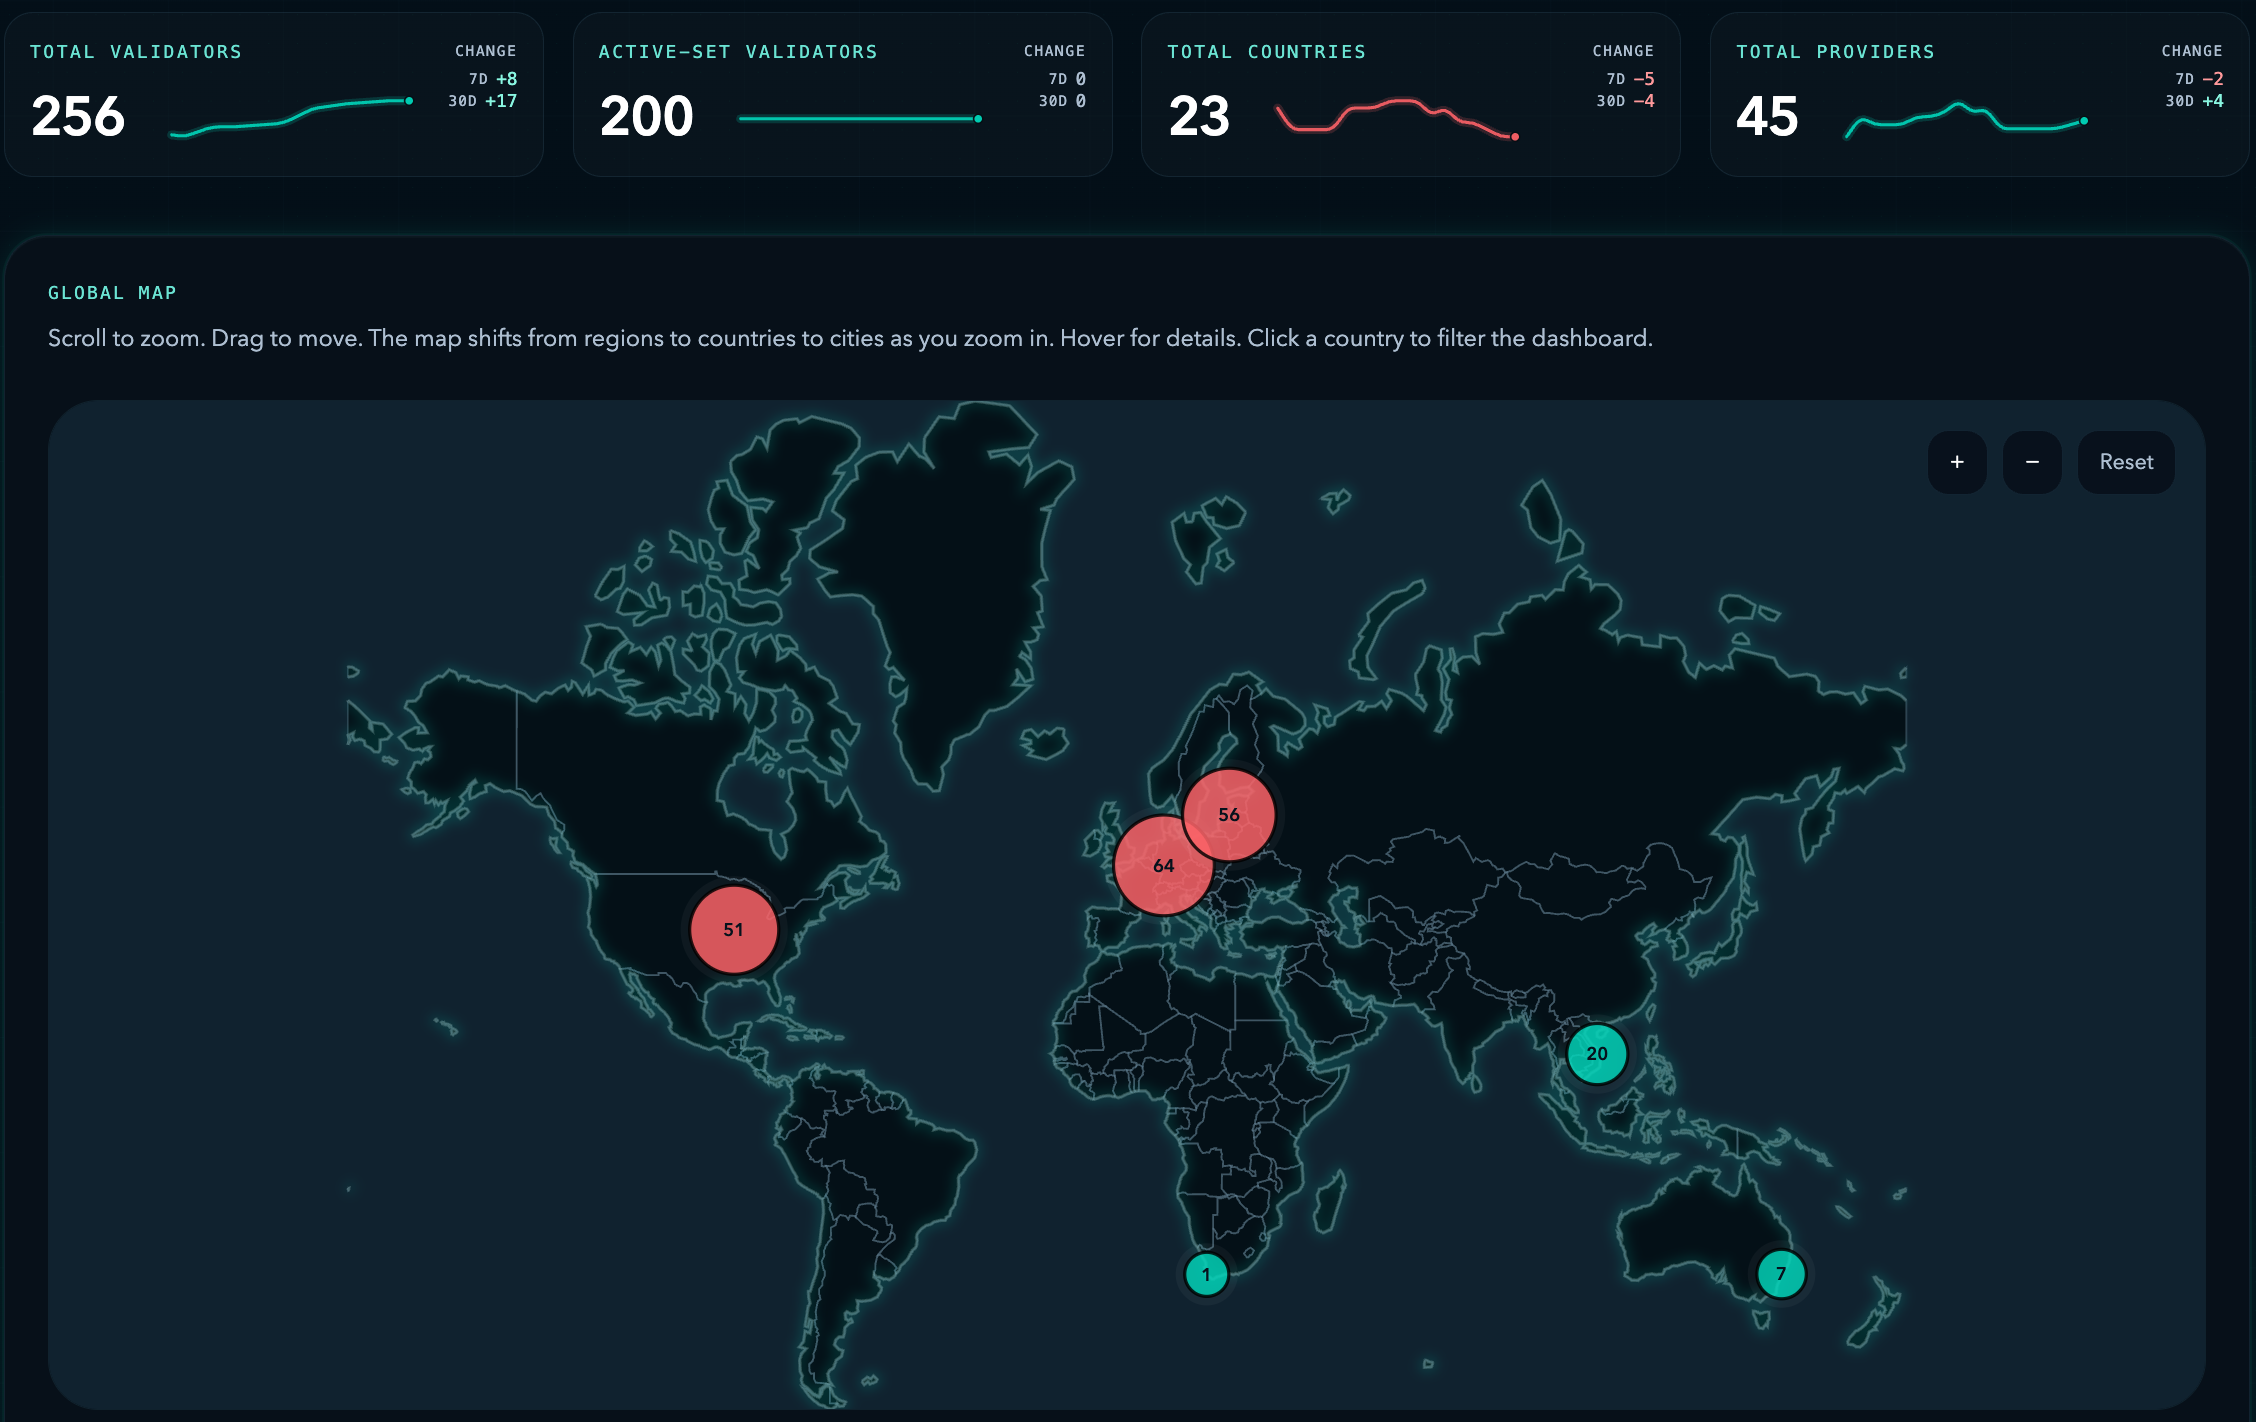
Written on April 9, 2026 from a Monad Geo data snapshot taken at 08:45 UTC. Monad testnet is no longer just a proving ground. It is increasingly functioning as a live intake layer for a broader validator field. The latest snapshot shows 256 total validators, 200 active validators, 23 countries, and 45 providers, which leaves 56 validators outside the active set around a full core.
That is the clearest structural takeaway in the report. Testnet is not short of operators. It is building depth around a fixed participation layer, which is exactly the kind of environment that can support stronger future expansion.
Global Snapshot
Context
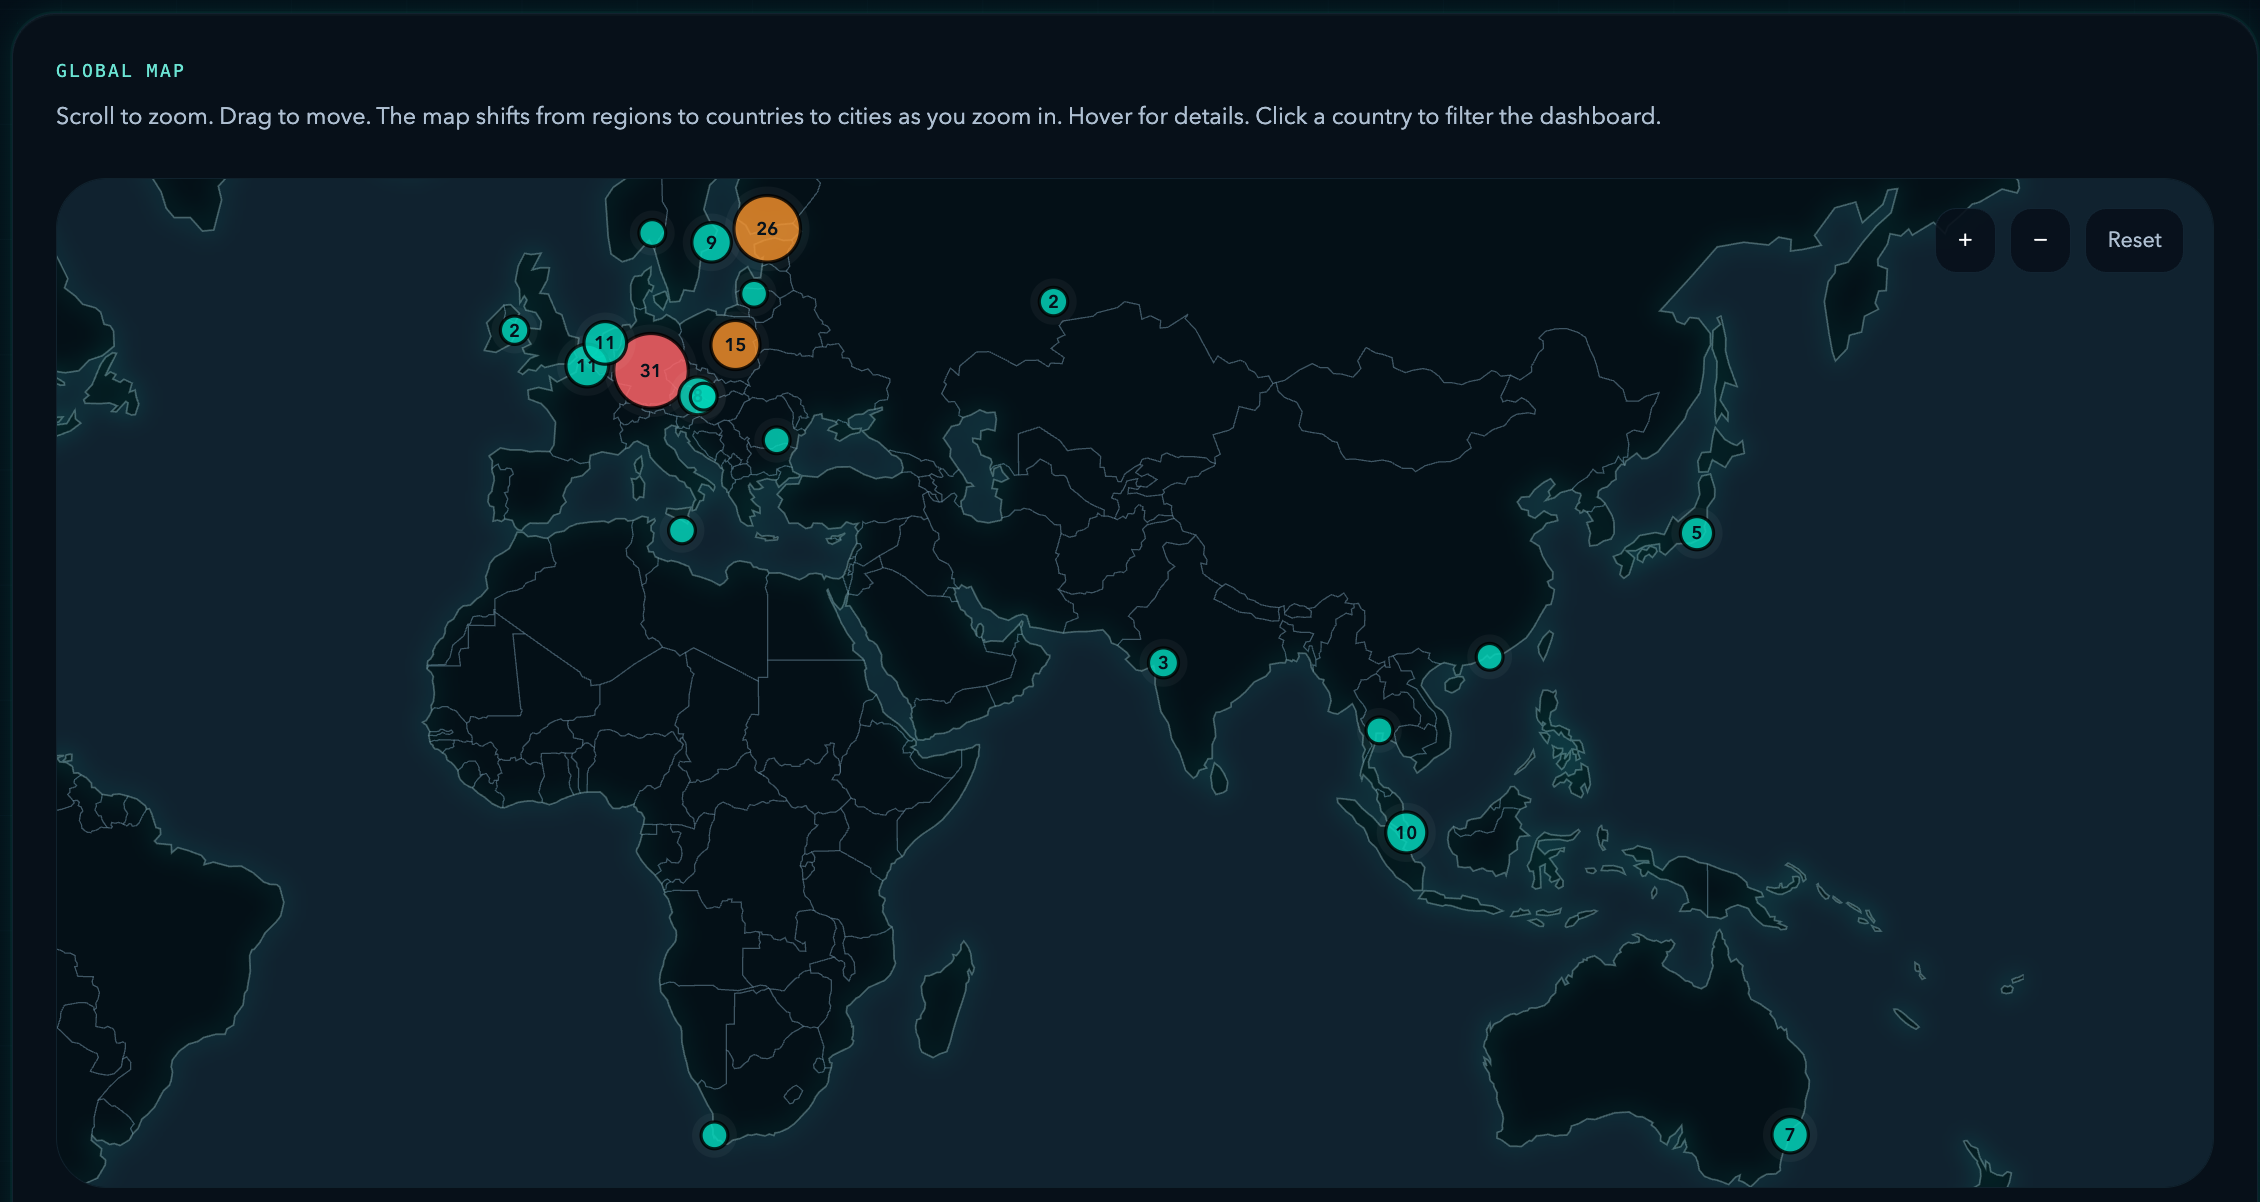
The big-picture view from the live Monad Geo dashboard is straightforward: Monad testnet has a full 200-validator active set and a growing outer validator bench around it. Europe and North America still form the largest mapped footprint, but the broader testnet field is now wide enough that the next additions can improve quality, not just increase count.
1. Testnet Is Already Operating in a Full 200-Seat Environment
With 200 active validators and 256 total validators, about 21.9% of visible validators currently sit outside active participation. That matters because it shows operator supply is already broader than current active capacity. In practical terms, testnet is building a bench around a full core rather than waiting for operators to appear.
Operational Impact
The structure also differs from the more queue-heavy mainnet pattern. Recent-entry records on testnet are already marked Active and consensus, usually with 11.00M stake and with country, city, and provider fields already mapped. That makes the signal stronger: testnet is not just collecting registrations, it is already bringing operators into live participation.
There is another useful detail in the turnover numbers. The latest 30-day list contains 18 first-seen validators, while total validator count is up 17 over the same period. That suggests the set is not only growing; it is also refreshing and rotating, which is exactly what you expect in a fixed active environment where composition can improve even when seat count does not.
2. The Latest Onboarding Wave Is Active and Geographically Broad
Operator Actions
The recent onboarding wave is concentrated in the last week. 13 of the 18 validators on the current 30-day list first appeared between April 1 and April 8, which means just over 72% of the visible onboarding wave arrived in roughly one week.
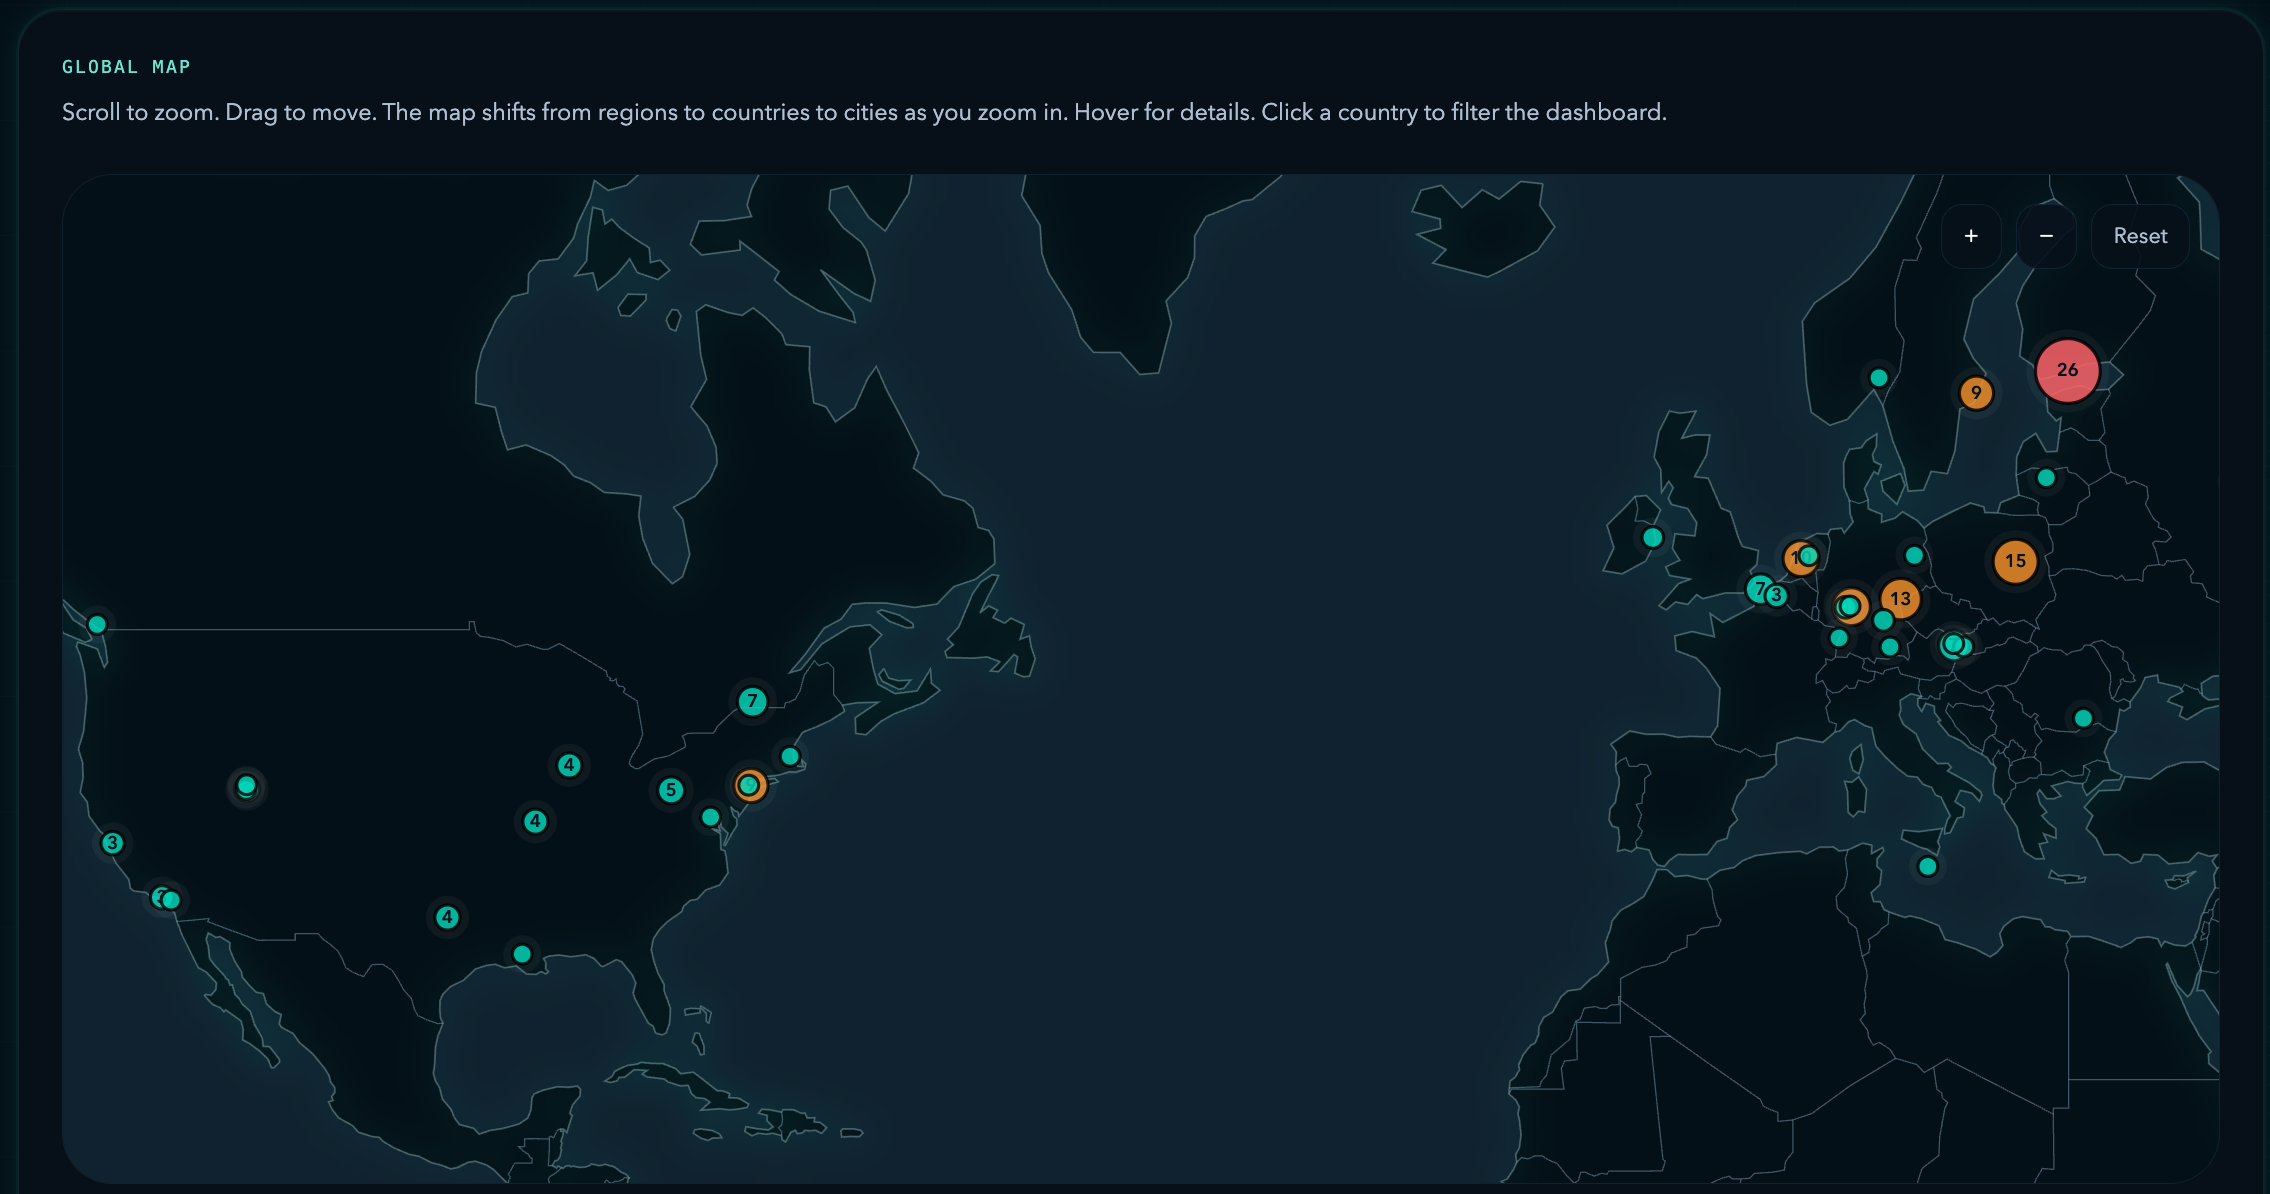
Recent additions span Japan, Finland, Poland, the Netherlands, Germany, and the United States. That matters because the latest wave is not limited to one country or one corridor. It also reveals clear infrastructure lanes already forming: Poland through MEVSPACE, Germany and Finland through Hetzner, and parts of the United States through Interserver and Cherry Servers.
Risk Watch
Europe and Asia together already show meaningful validator density outside North America, while the transatlantic corridor remains the operational core. The more important signal is that new validators are not appearing as passive placeholders. They are arriving as active participants, which makes testnet a much stronger onboarding surface for the next phase of the validator field.
3. The Regional Footprint Is Global, and the Next Gains Are Easy to Spot
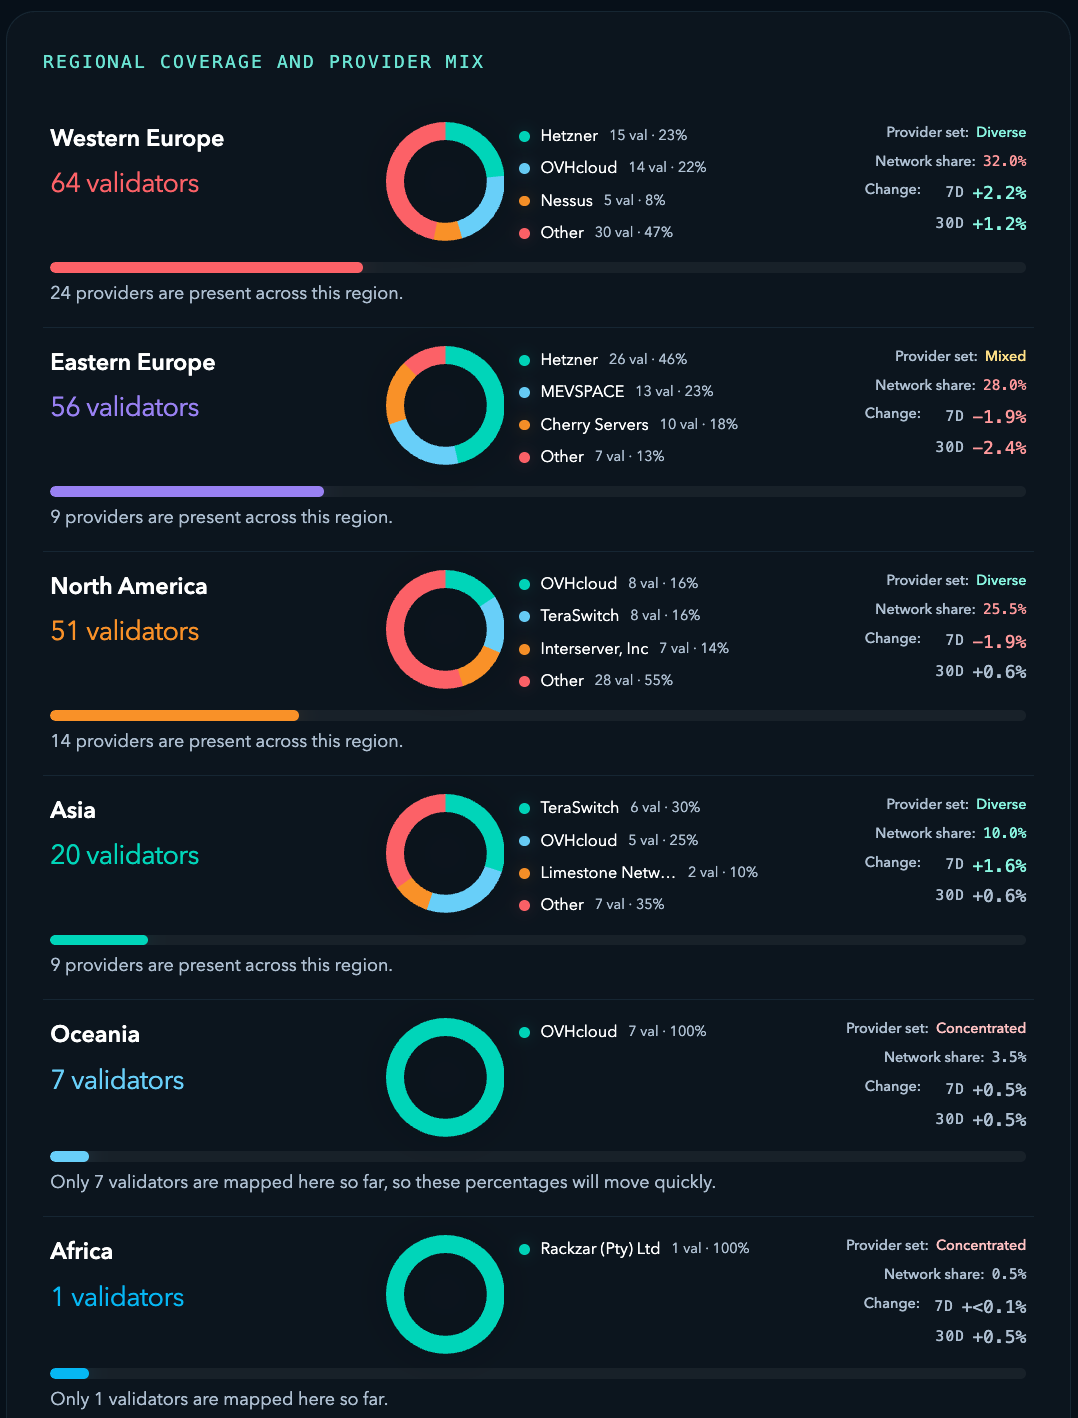
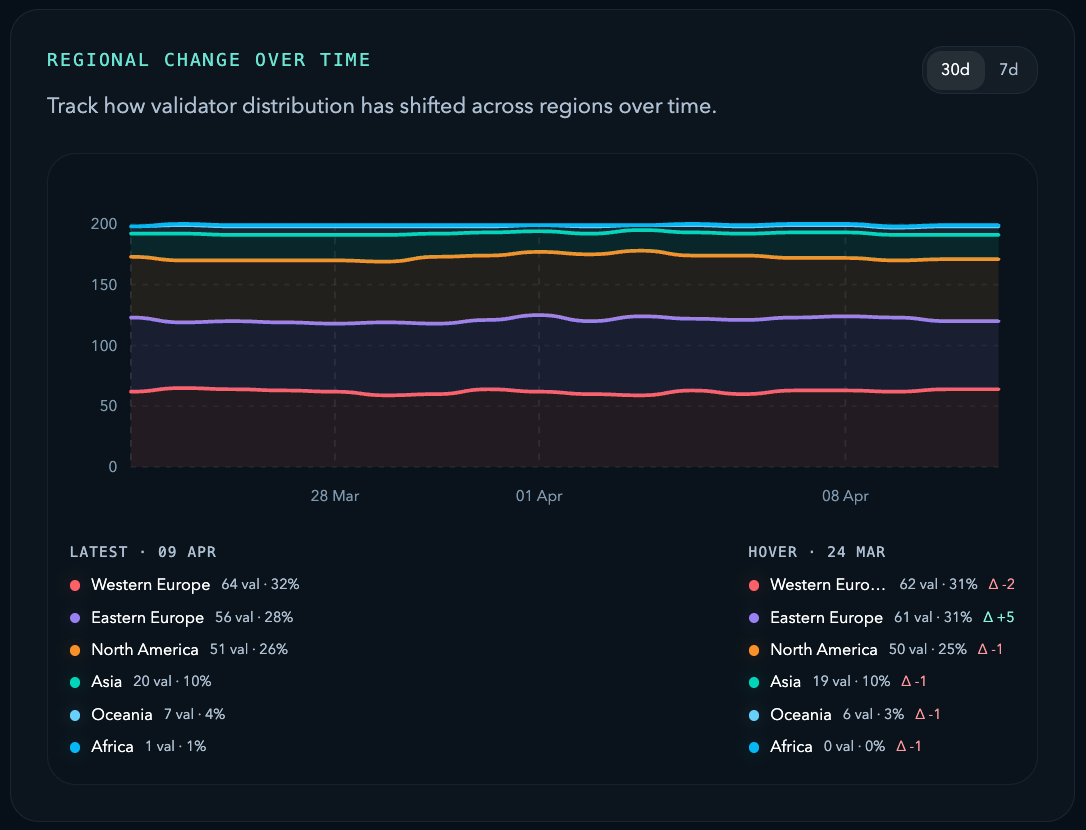
The current regional split is already meaningful:
- Western Europe: 64 validators, 32.0%
- Eastern Europe: 56 validators, 28.0%
- North America: 51 validators, 25.5%
- Asia: 20 validators, 10.0%
- Oceania: 7 validators, 3.5%
- Africa: 1 validator, 0.5%
That means Western Europe, Eastern Europe, and North America together account for 171 of 200 active validators, or 85.5% of the mapped active footprint. Europe alone accounts for 60.0%. This is best read as an improvement map rather than a weakness. Early infrastructure networks usually follow the strongest hosting corridors first; what matters now is that testnet already shows where the next validators can create the most structural value.
Asia stands out as the clearest opportunity because it already has enough validator presence to matter and enough provider diversity to absorb growth constructively. Oceania is already visible but fully concentrated, which means the next validator there matters most if it arrives through a different host. Africa is still small in count, but even modest growth there would have outsized structural value.
4. Country Breadth Is Healthy, and the Next Upgrade Is Local Diversification
The country layer is already broad enough to be meaningful. Top countries are:
- United States: 43 validators, 21.6%
- Germany: 31 validators, 15.6%
- Finland: 26 validators, 13.1%
- Poland: 15 validators, 7.5%
- France: 11 validators, 5.5%
- The Netherlands: 11 validators, 5.5%
- Singapore: 10 validators, 5.0%
The top three countries account for 50% of the active set, and the top five account for 63%. That is already a broad country base. The next step is not simply more countries; it is better provider composition inside the countries that already matter most.
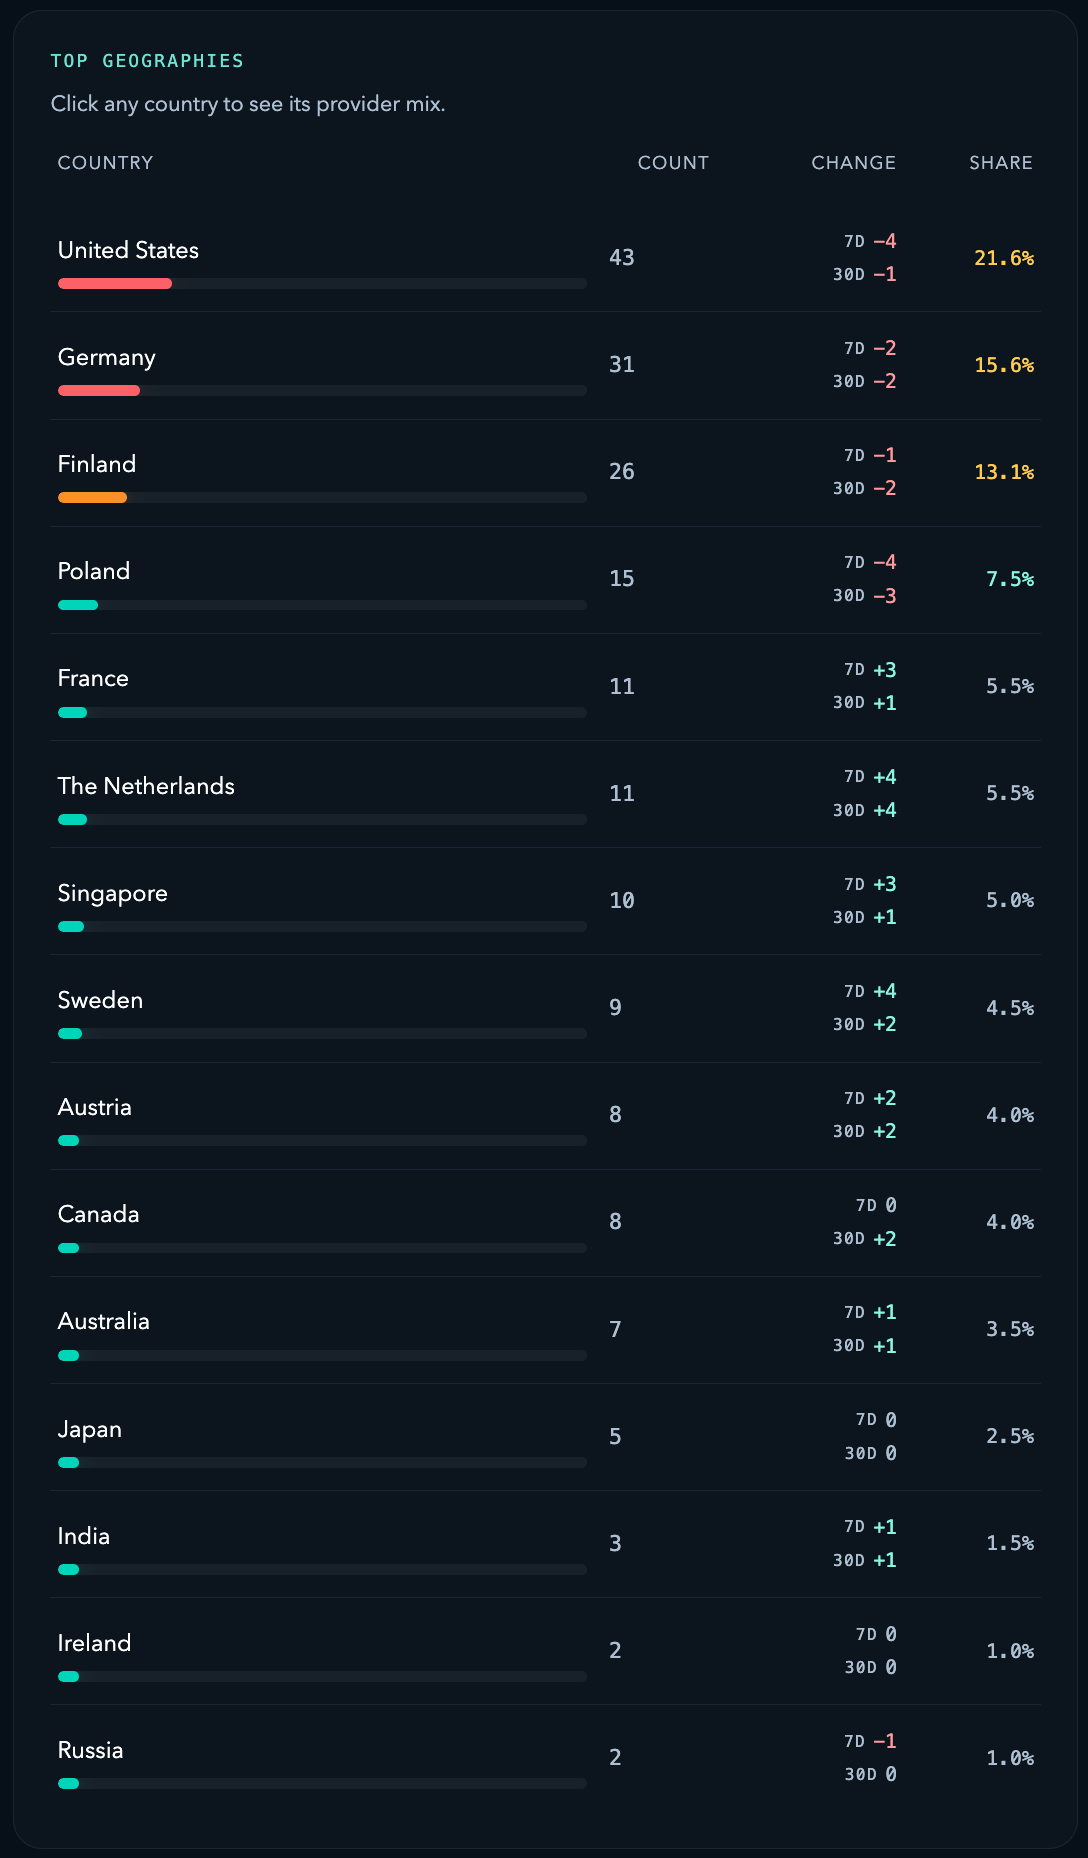
The country-provider mix makes the improvement path clearer. The United States looks diverse and fairly balanced. The Netherlands also distributes well relative to its size. Germany is mixed, with room to improve spread. Finland has high validator count but a concentrated provider base, and Poland has strong presence with a clear opportunity to add more local host variety. Countries like France, Sweden, Australia, and Canada are already meaningful enough that their next gains are better read through diversification than through raw count.
5. Provider Diversity Is Strong at the Top Level, with Room to Improve Regionally
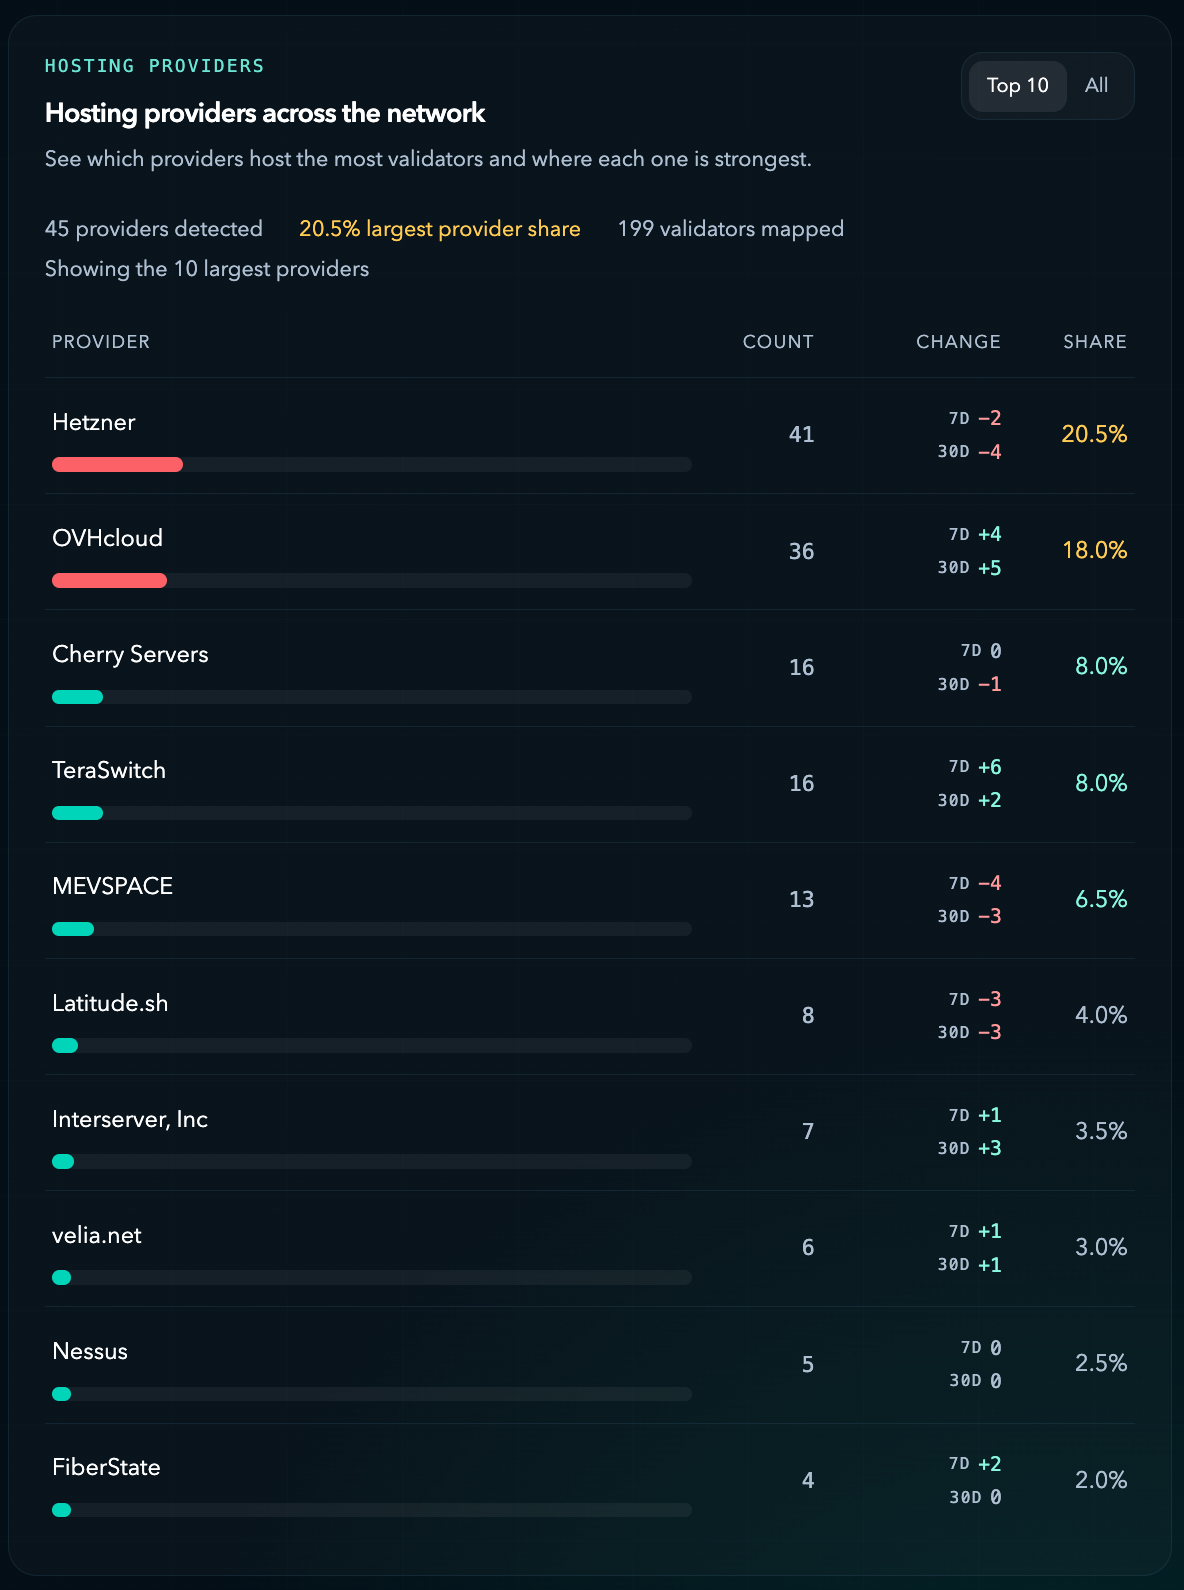
The provider distribution is encouraging overall:
- Hetzner: 41 validators, 20.5%
- OVHcloud: 36 validators, 18.0%
- Cherry Servers: 16 validators, 8.0%
- TeraSwitch: 16 validators, 8.0%
- MEVSPACE: 13 validators, 6.5%
- Latitude.sh: 8 validators, 4.0%
- Interserver, Inc: 7 validators, 3.5%
There are 45 providers in total, and the largest provider share is only 20.5%. That is a constructive sign: the network is not dependent on a single global host. The more useful question now is where provider diversity is already strong and where it can improve most.
At the regional level, Western Europe already looks broad and balanced, North America is diverse and relatively resilient, Eastern Europe is functional but more concentrated, Asia is already diverse enough to absorb growth well, and Oceania is the clearest place where another provider path would improve resilience immediately.
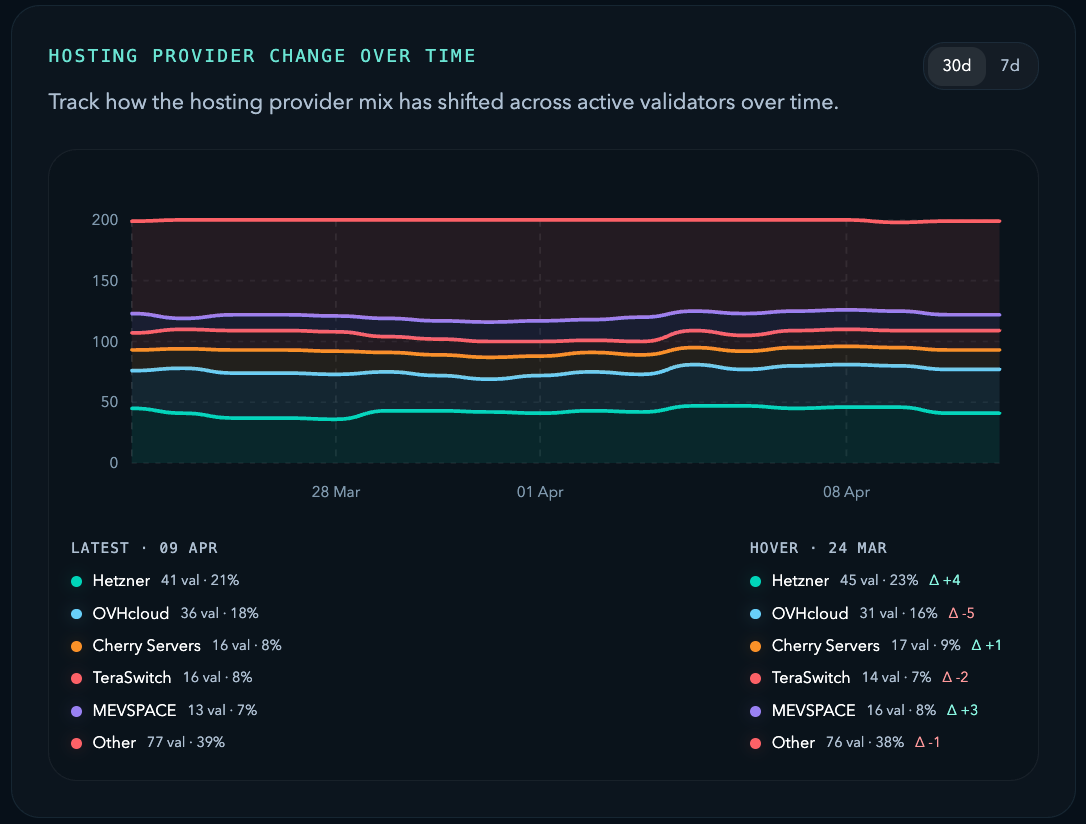
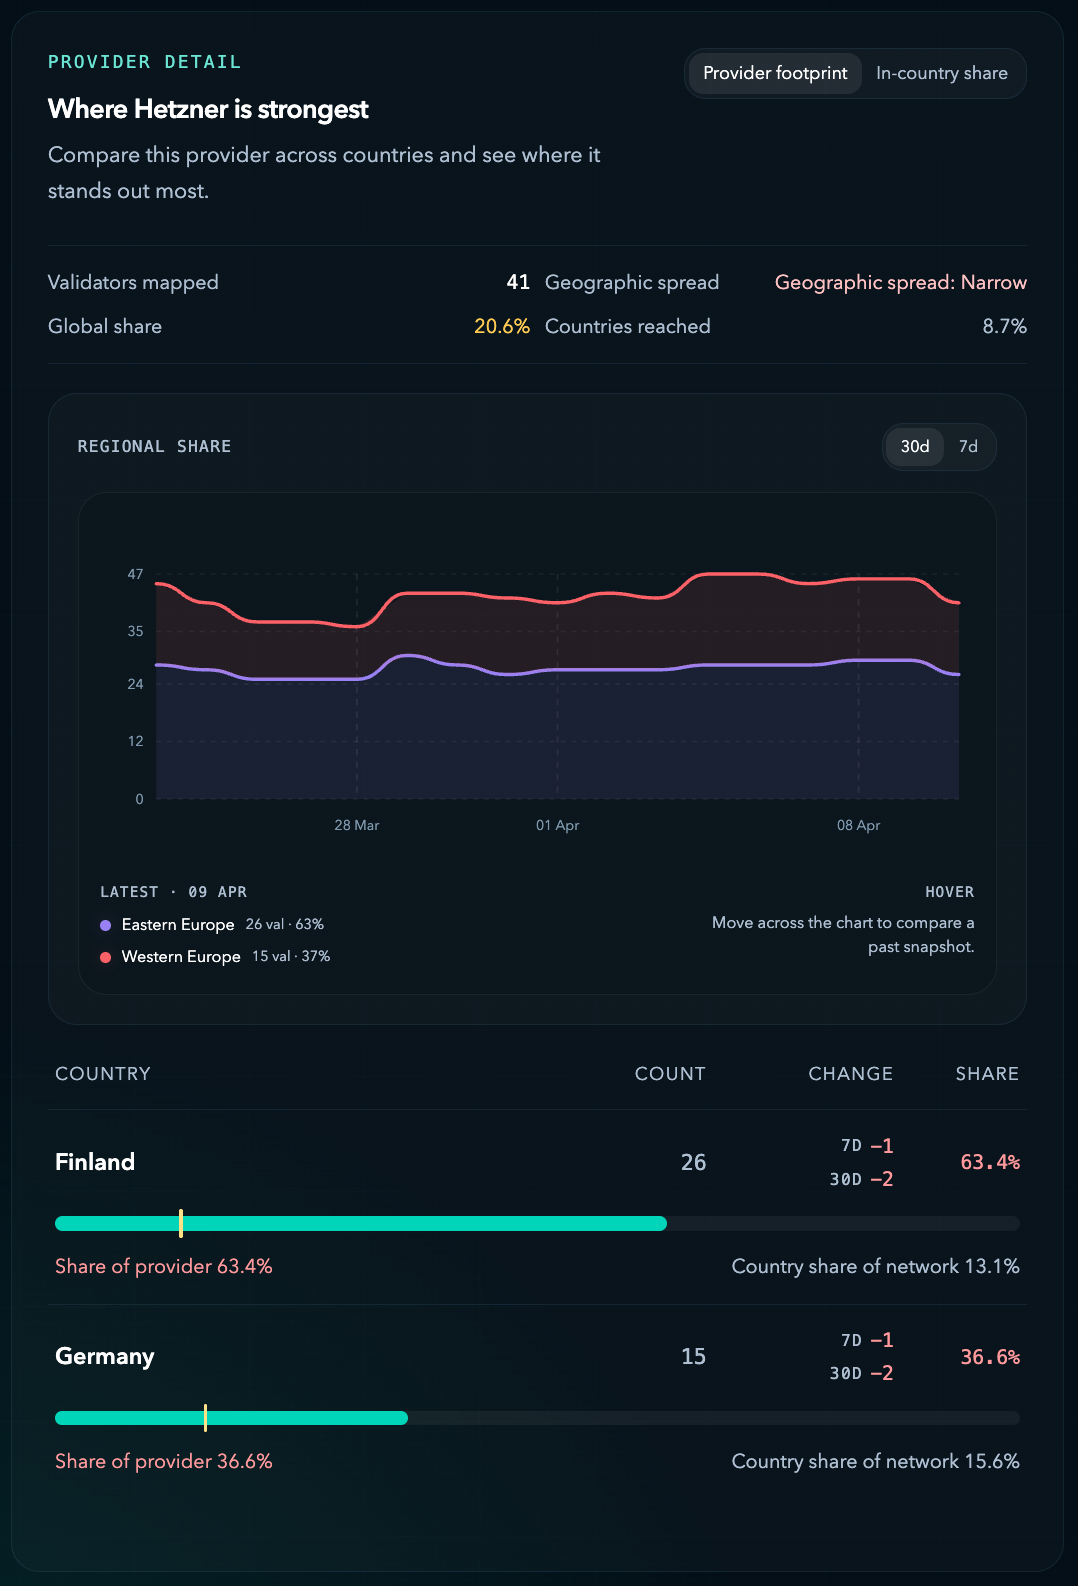
6. Hetzner, OVHcloud, and Cherry Servers Show Three Different Growth Patterns
The provider detail views explain what better distribution means in practice. Hetzner is the largest provider at 41 validators and 20.6% share, but its footprint is also geographically narrow, with most visibility still sitting in a Finland-Germany corridor. OVHcloud combines scale with broader country reach, making it one of the stronger examples of how a large provider can still support a more distributed network. Cherry Servers sits in the middle, with meaningful footprint across multiple regions and especially strong visibility in Sweden, plus additional spread into the US, the Netherlands, and Lithuania.
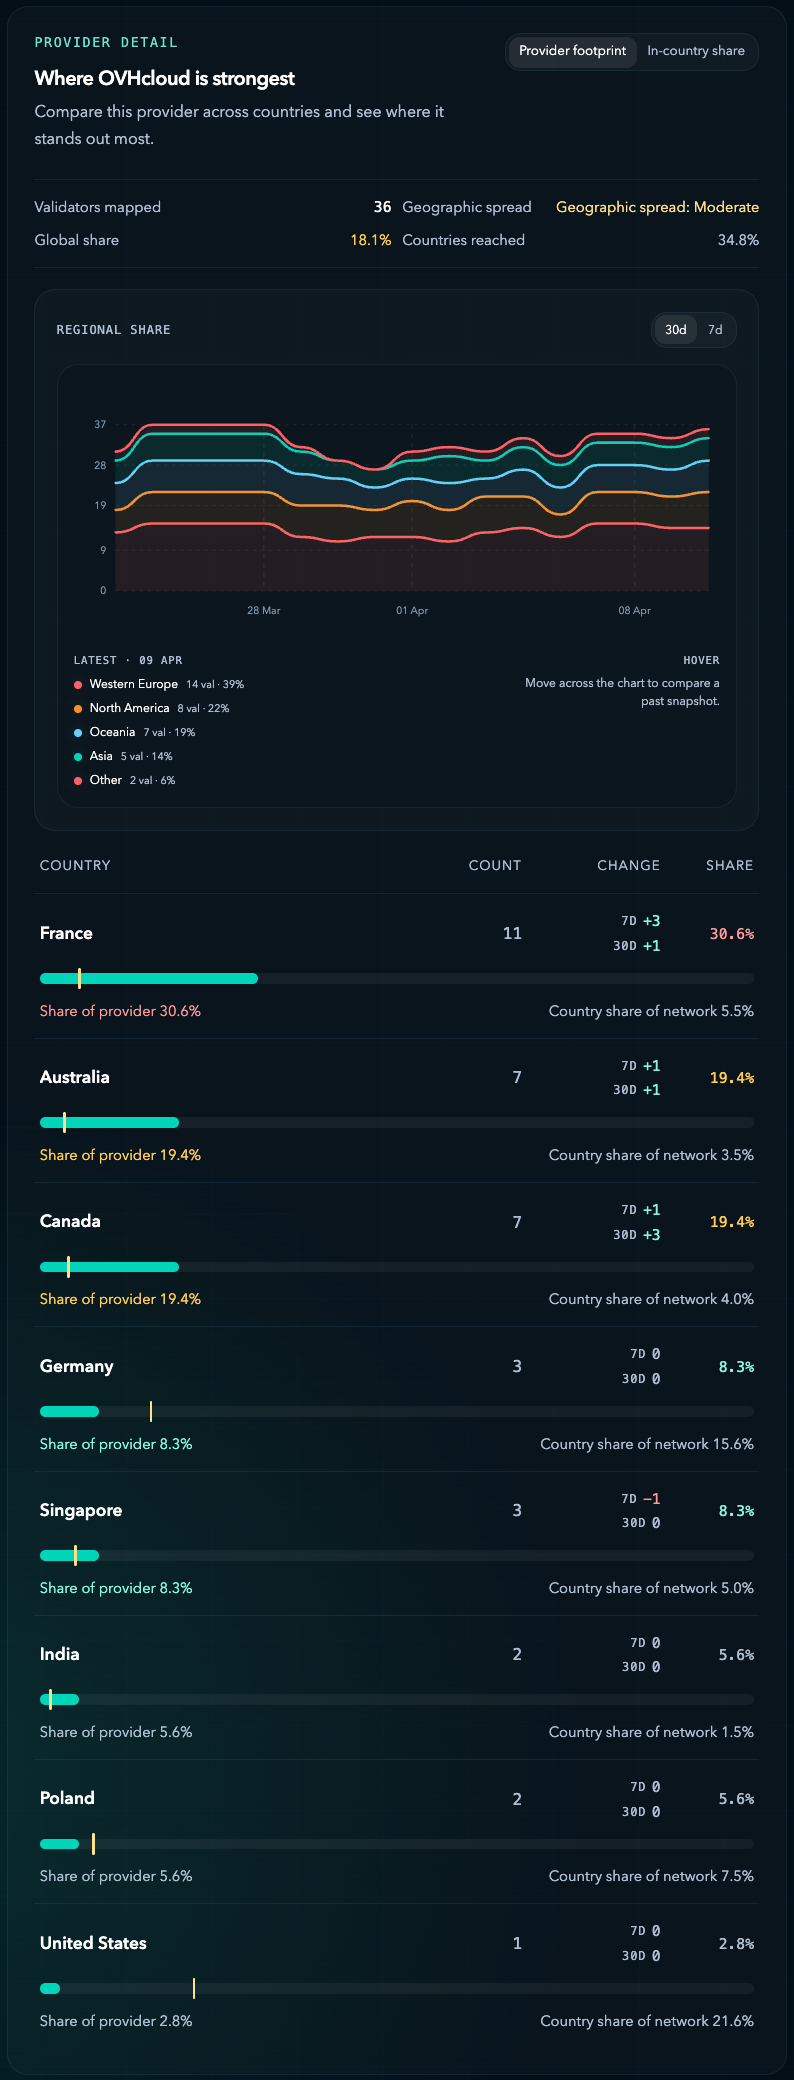
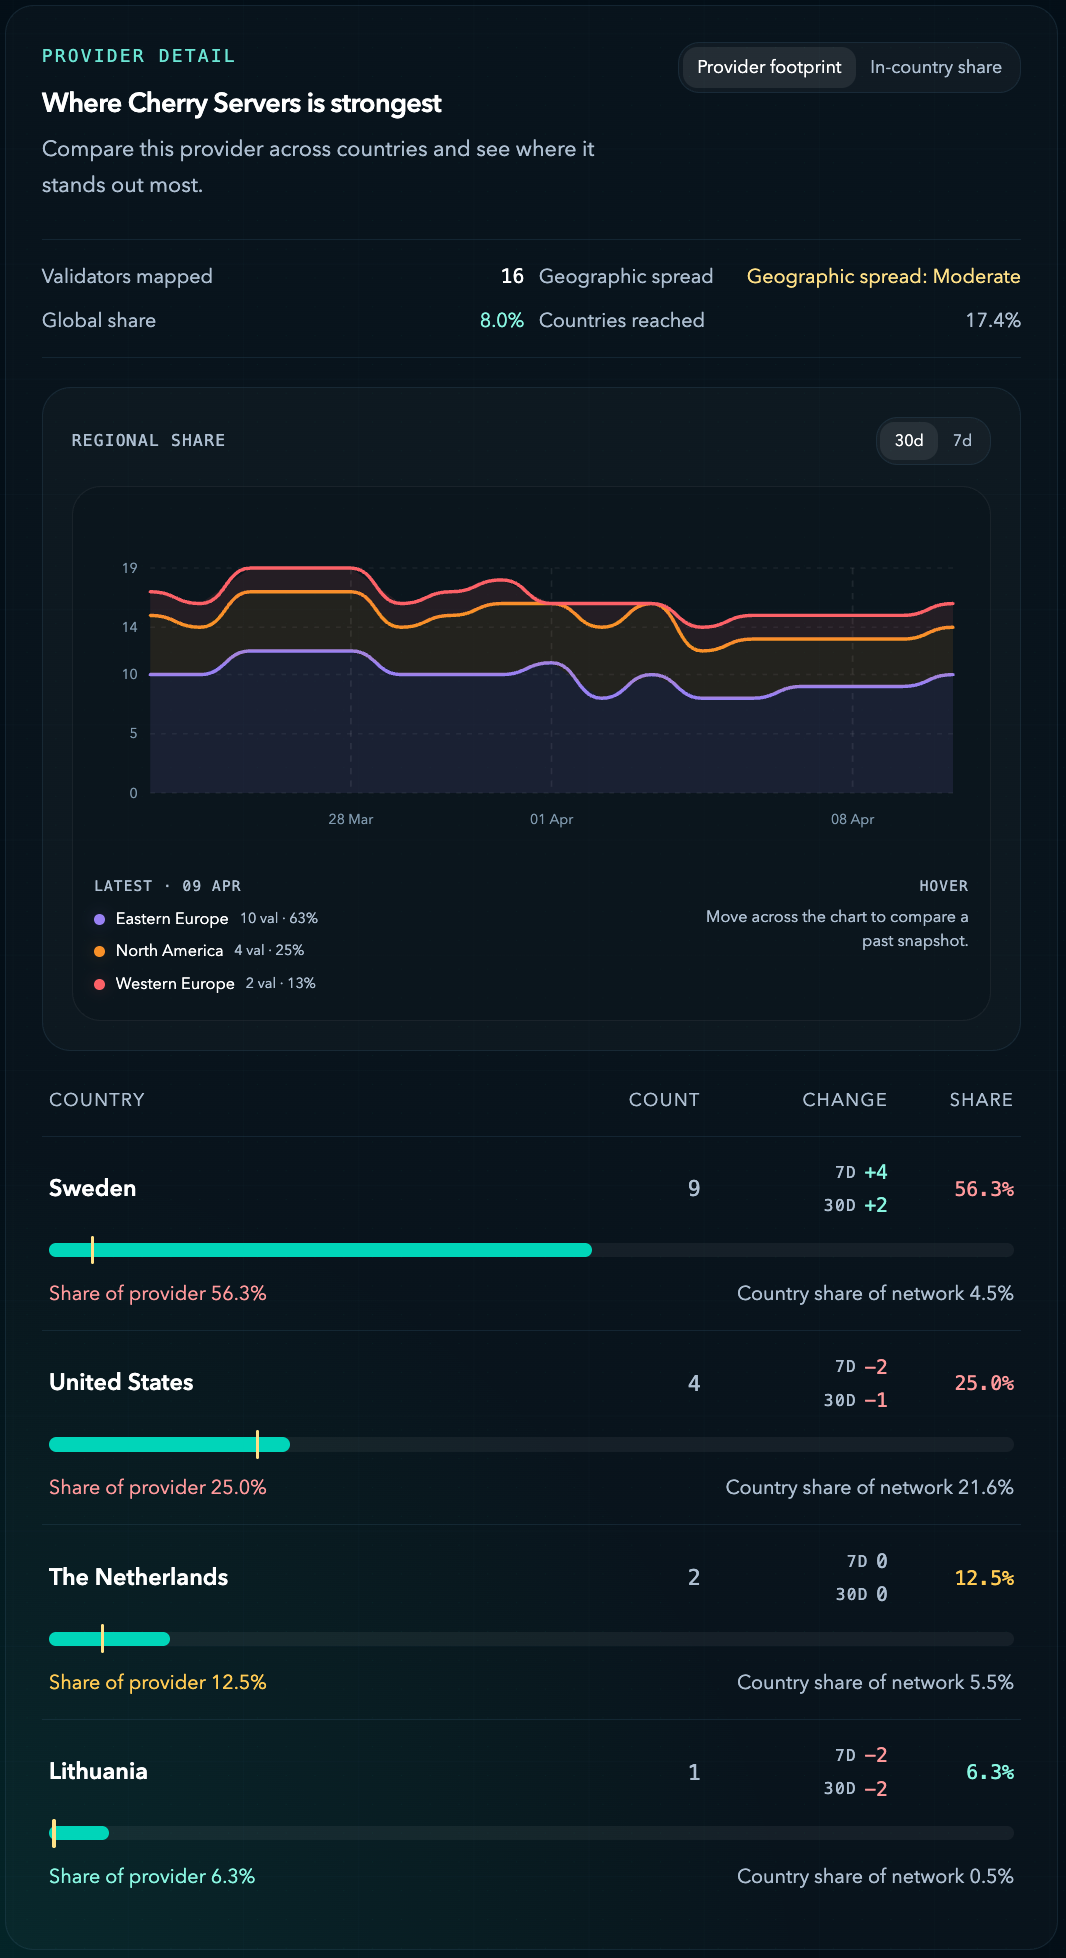
Taken together, these three providers show the difference between pure scale and constructive distribution. The next gains will come less from making a big provider bigger and more from how providers extend across regions and countries that already matter.
7. The Matrix View Turns Decentralization into a Placement Problem
The matrix views tie the whole picture together. At the region level, they show where provider variety is already broad and where one host still carries too much of the local footprint. At the country level, they show which countries already carry meaningful validator count but still lean heavily on one provider path. That makes the current snapshot useful because it turns decentralization from an abstract target into a practical placement problem.
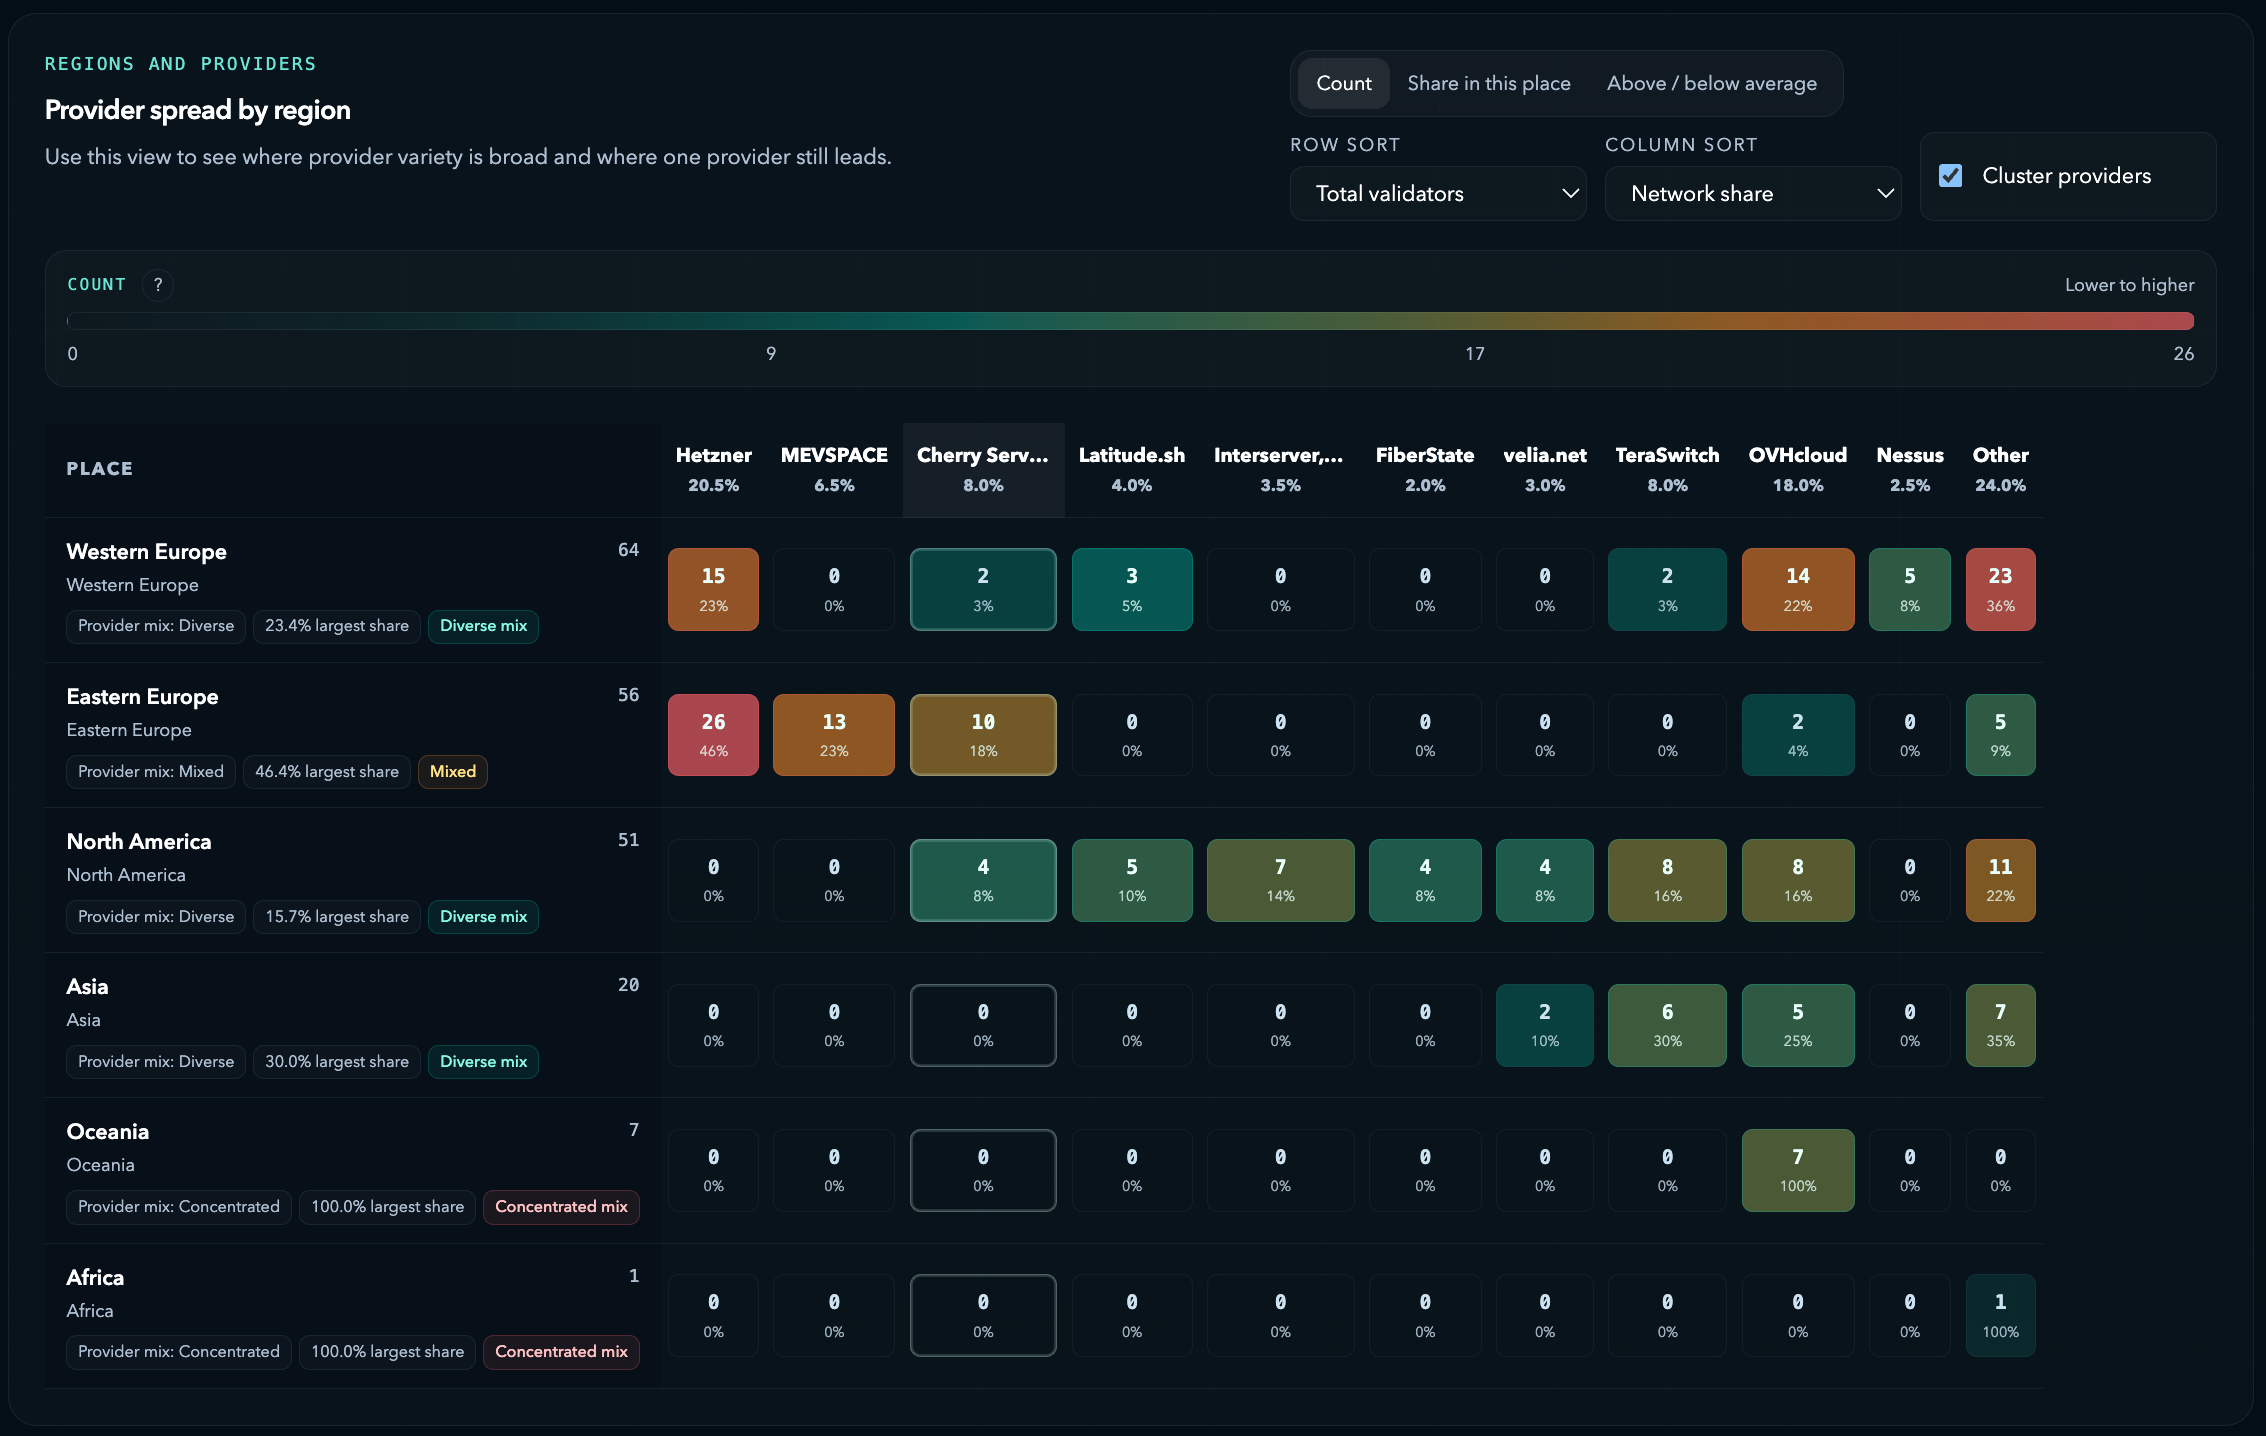
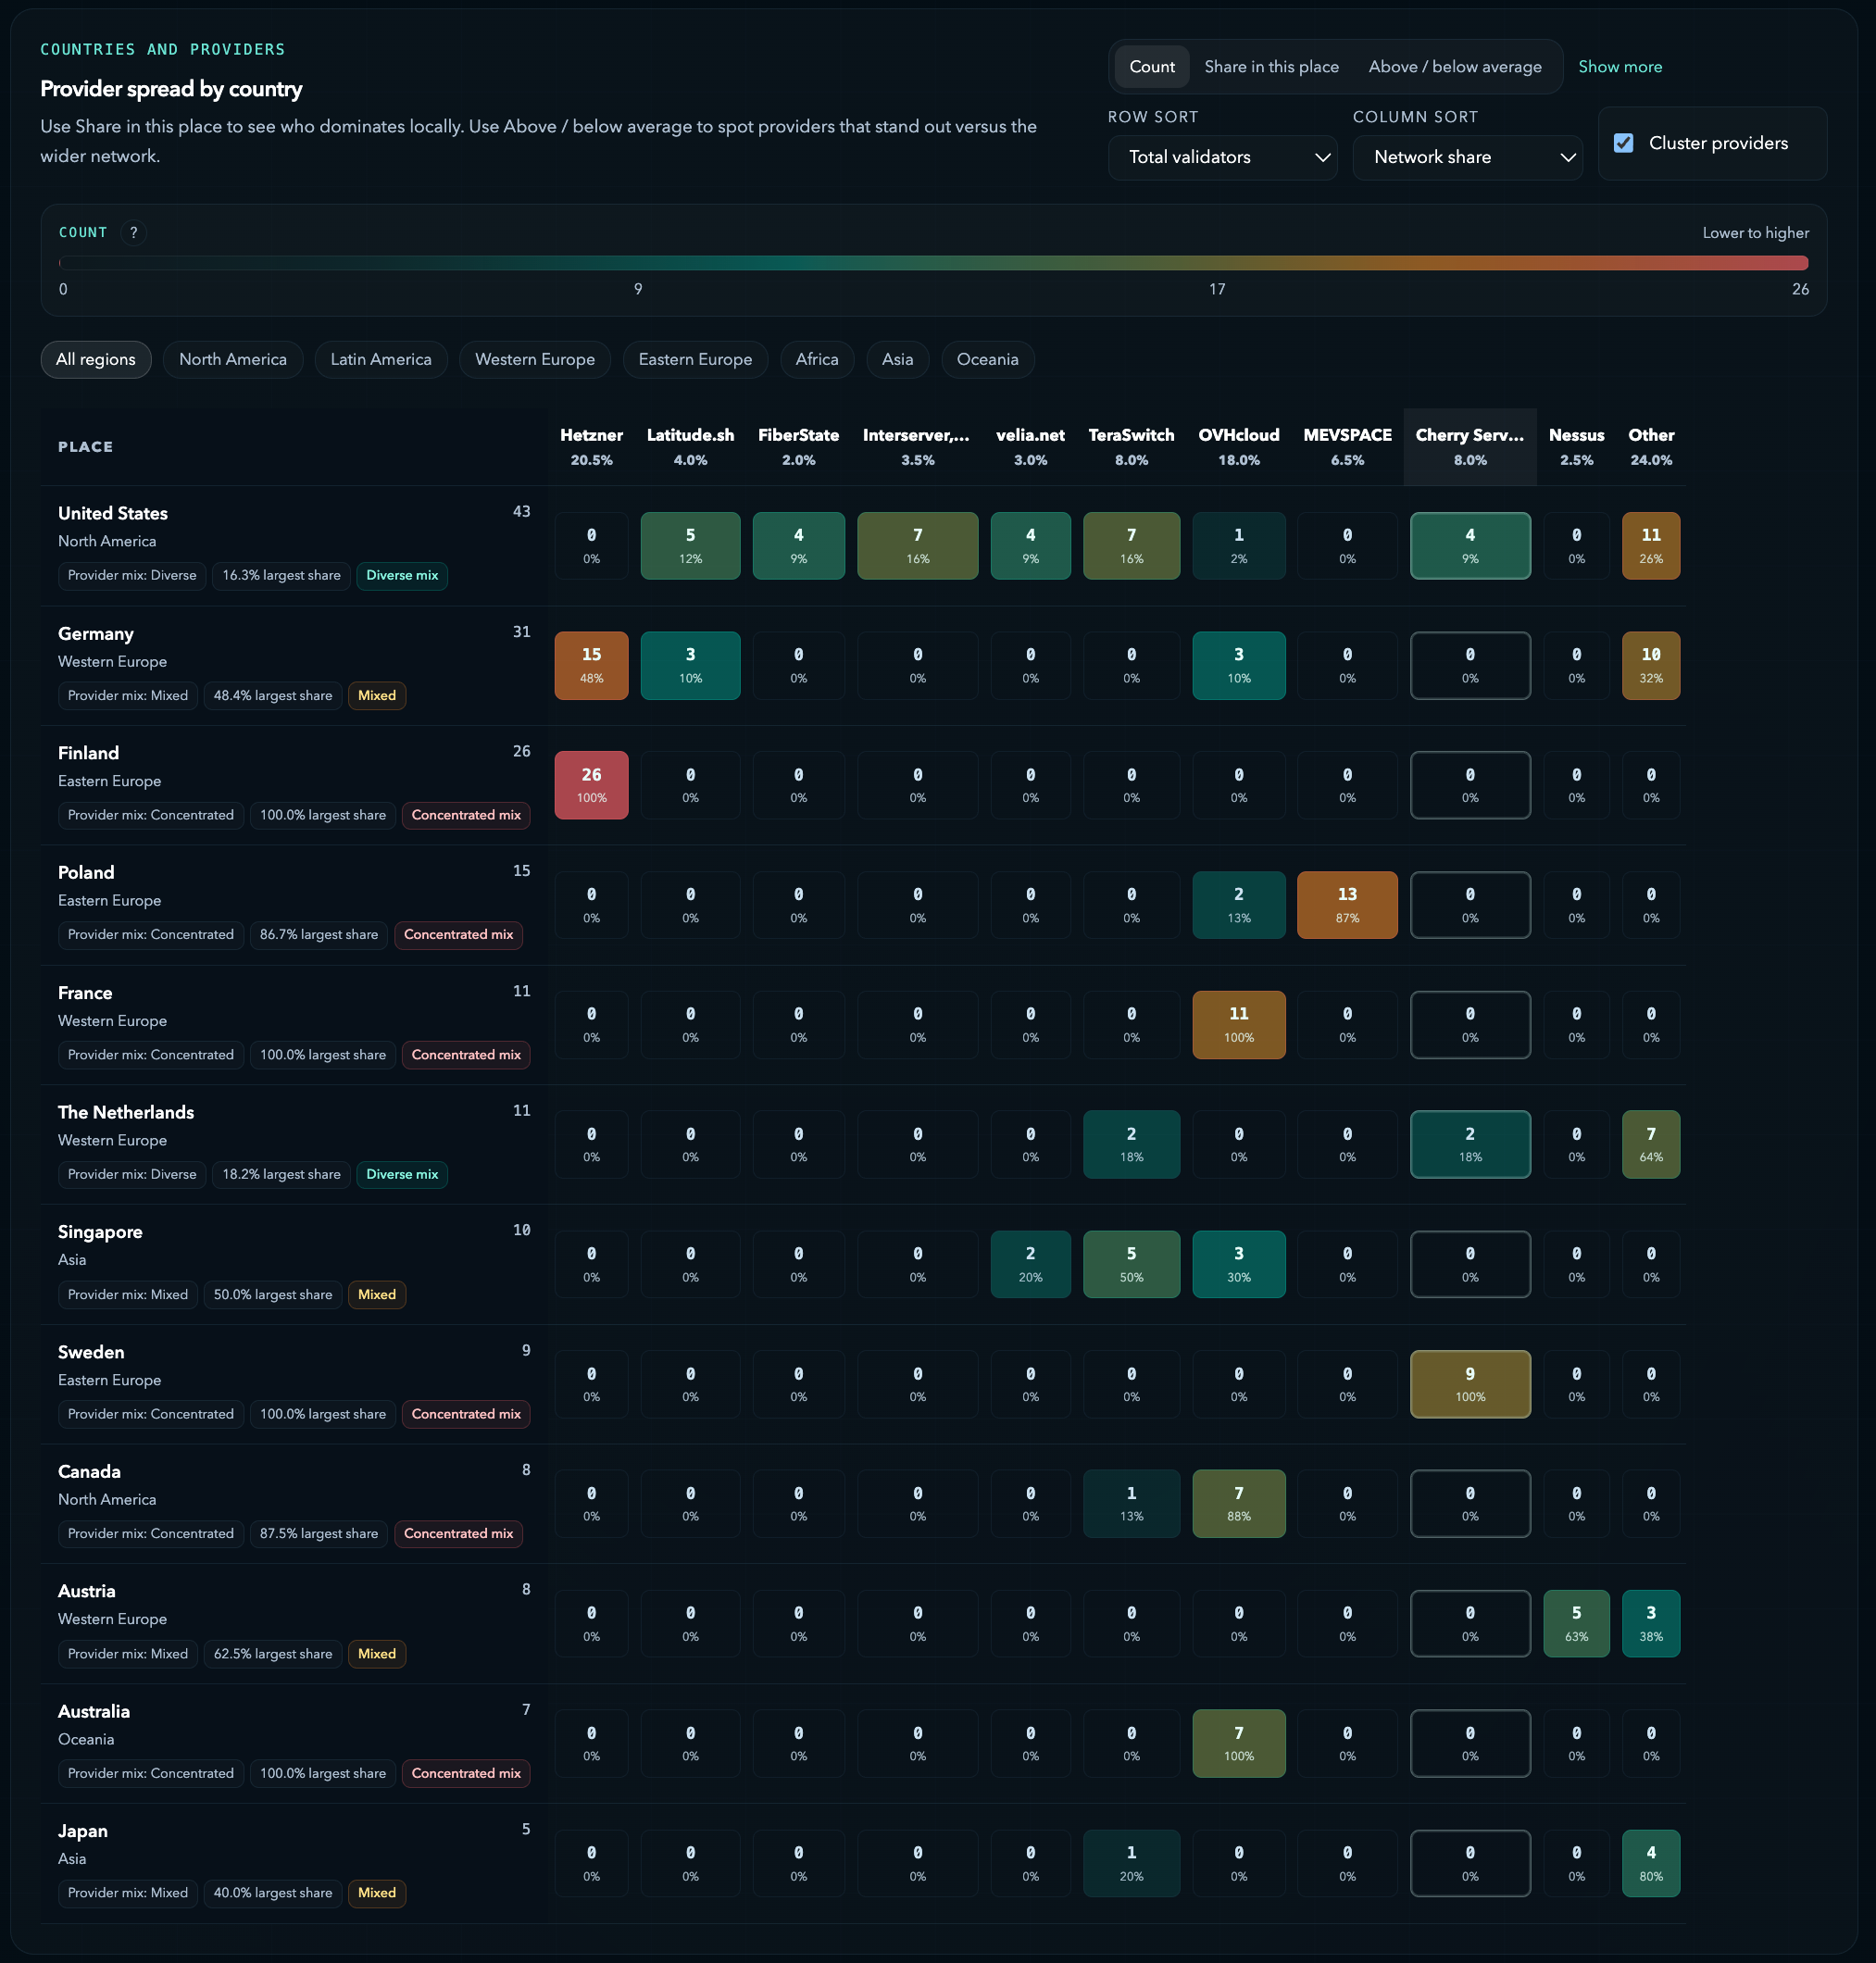
The next gains are highly visible. More Asia can improve both geography and provider balance. More Oceania matters most when it comes through a different host. More Finland, Poland, France, Canada, Sweden, and Australia matters most when it improves local provider mix rather than simply adding another validator in the same lane.
Why This Aligns with MIP-9 and Mainnet Expansion
This testnet picture matters because it already resembles the kind of structure you would expect before a broader active-set chapter on mainnet. On mainnet, MIP-9 proposes moving from 200 to 250 active seats. On testnet, the network is already operating with a full 200-validator active ring and a wider 256-validator field around it. That makes the logic of expansion easier to understand: the operator field is already deeper than the current active size.
The VDP reinforces that interpretation. Since operators are evaluated partly on active testnet uptime and are expected to continue operating on testnet while in the program, testnet is already doing part of the onboarding and competitive filtering work that a wider mainnet validator field will need.
Sources
- Monad testnet now has 256 total validators around a full 200-validator active set, leaving 56 outside participation.
- Recent onboarding is active consensus onboarding, not passive registration, which makes the outer bench more meaningful.
- Europe and North America still dominate the mapped footprint, but Asia and Oceania offer the clearest next gains.
- The best next improvements come from provider diversification inside already-important countries, not raw country count alone.