
BitCtrl Launches Monad Geo, a Live Dashboard for Validator Geography and Provider Distribution
Overview
Written on March 31, 2026. BitCtrl is launching Monad Geo, a live analytics dashboard built to make validator geography and infrastructure distribution across Monad easier to read in practical terms. Instead of stopping at headline validator counts, the dashboard combines regional share, country footprint, provider presence, and cross-referenced infrastructure context into one interactive surface. At the current snapshot, Monad Geo tracks 192 total validators, 170 active validators, 26 countries, and 43 providers. That already points to a network with meaningful international reach, but the dashboard is designed to show more than totals: it helps users see where distribution is strongest, where provider diversity is already broad, and where future growth can add the most strategic value.
A Live Picture of Global Validator Distribution
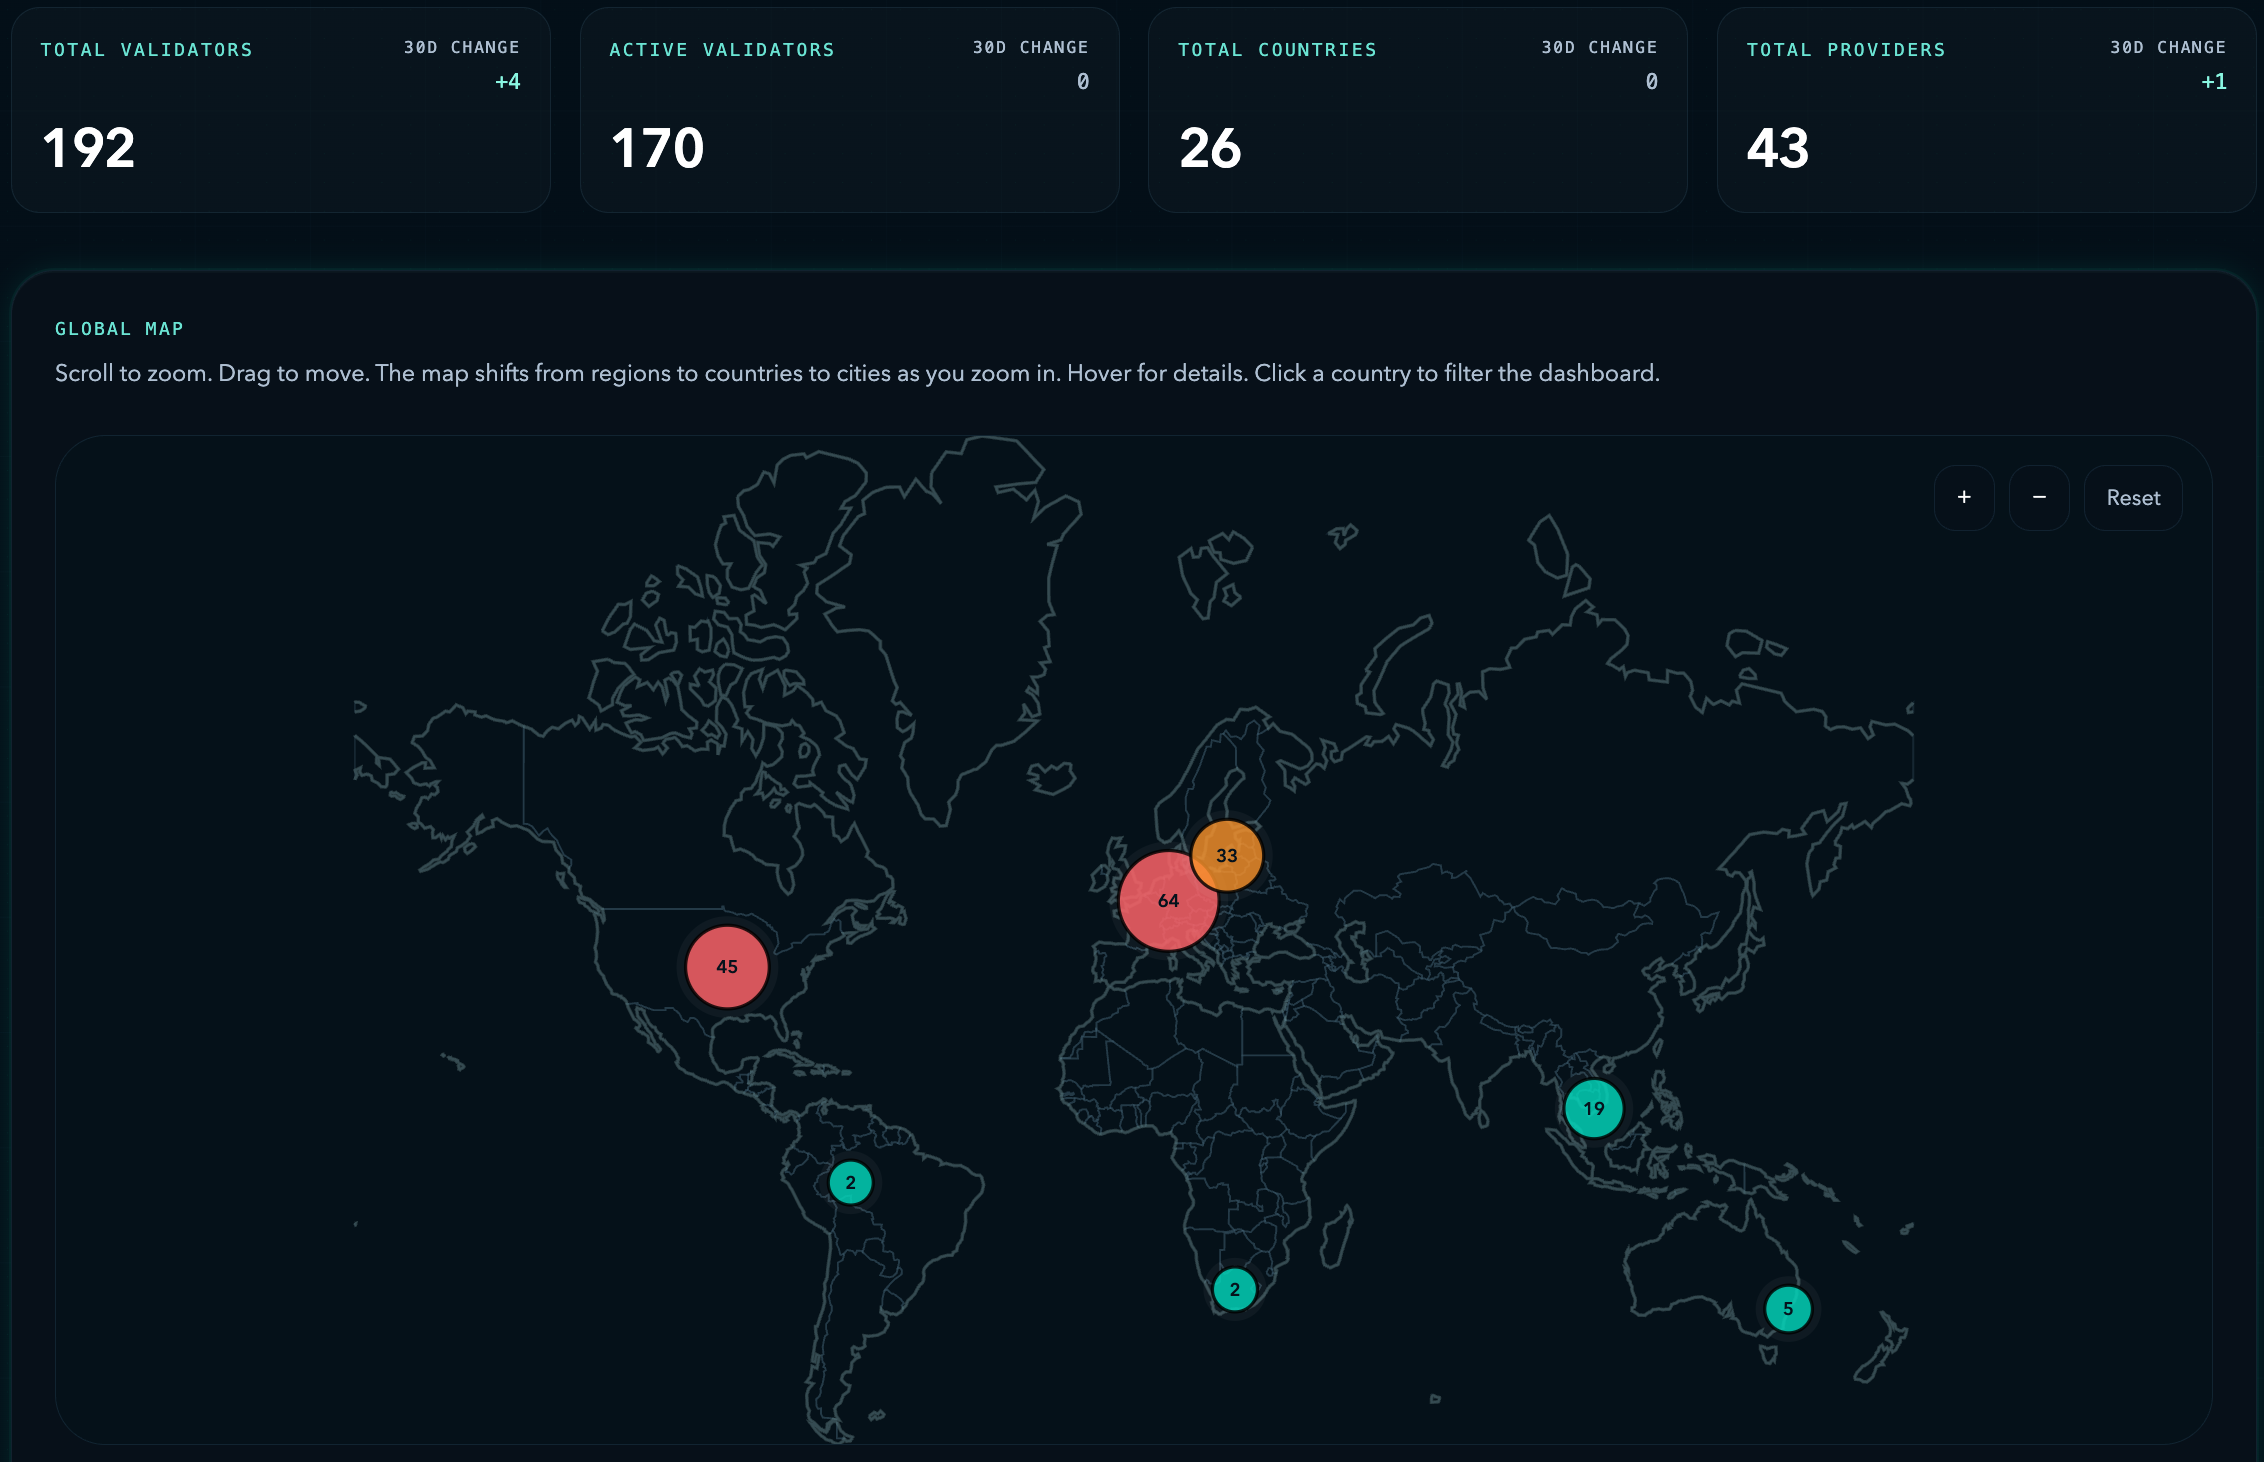
Monad Geo's regional layer immediately shows that Monad is developing a meaningful global footprint. Western Europe currently leads with 64 validators and 37.6% of mapped share. North America follows with 45 validators and 26.5%, while Eastern Europe adds 33 validators and 19.4%. Asia contributes 19 validators and 11.2%. Beyond those core regions, the network is also visible in Oceania, Africa, and Latin America, creating a broader international base rather than a single-country story.
Context
That framing matters. Some regions already act as strong validator hubs, while others still represent expansion headroom. Monad Geo makes that structure visible at a glance so users can read growth potential alongside existing concentration.
Country-Level Hubs and Provider Panels
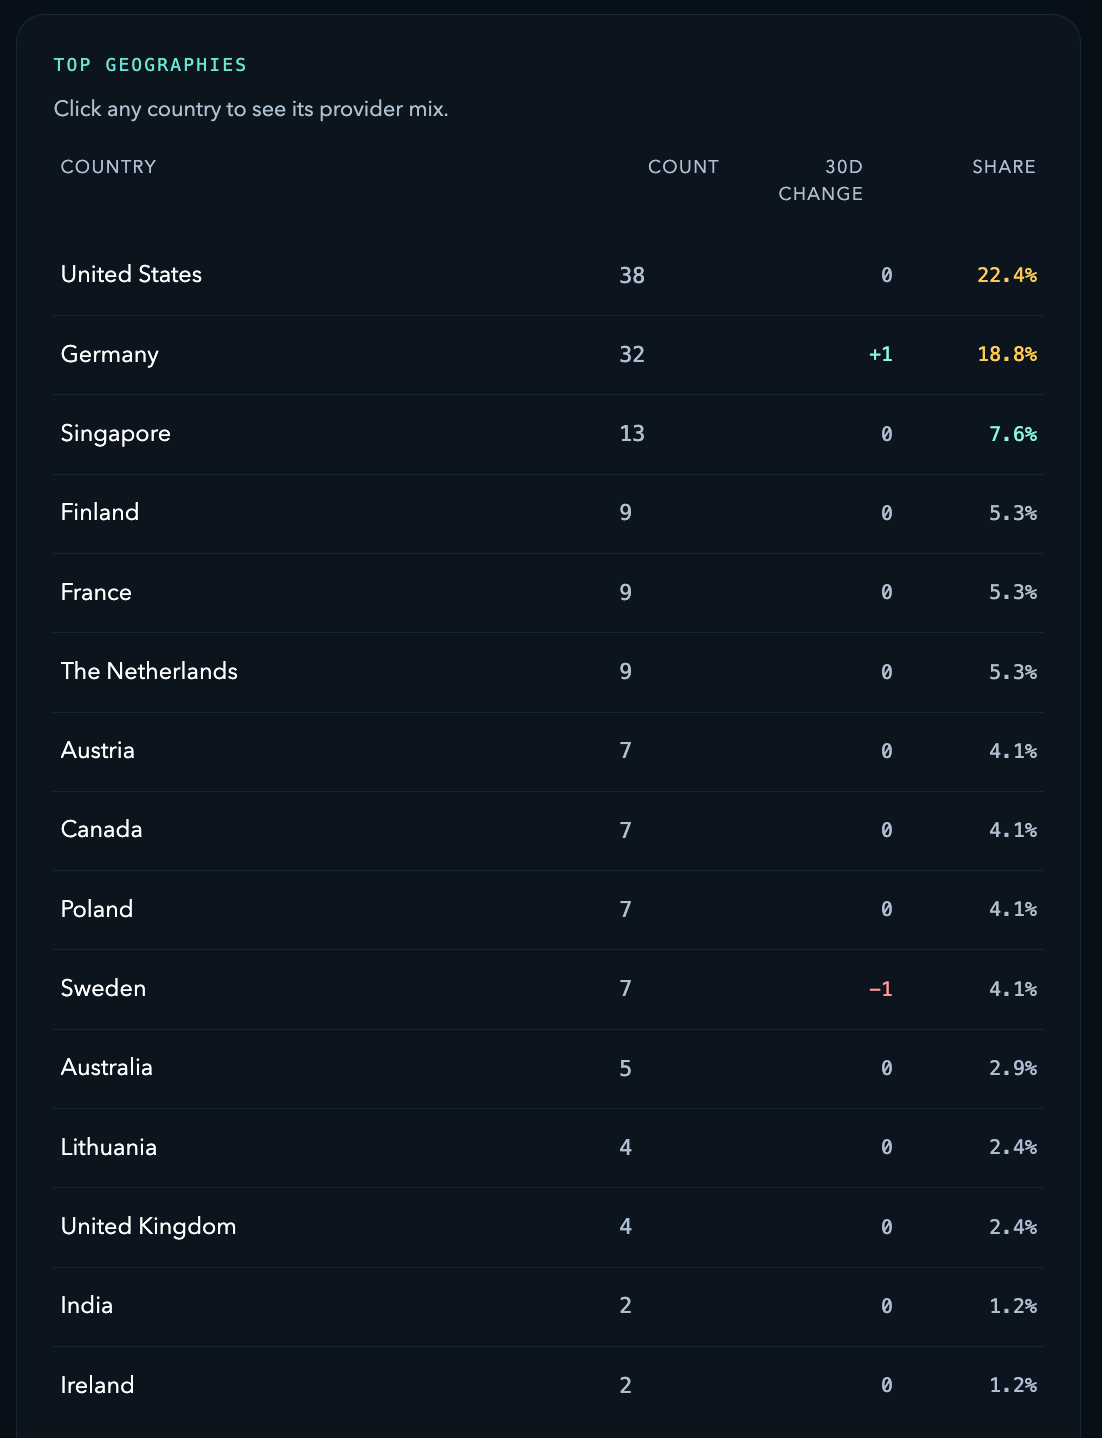
The Top Geographies layer adds the next level of precision. The United States currently leads with 38 validators and 22.4% of visible share. Germany follows with 32 validators and 18.8%. Singapore holds 13 validators and 7.6%. Behind them sit Finland, France, and the Netherlands with 9 validators each, followed by Austria, Canada, Poland, and Sweden with 7 each.
Operational Impact
This paired view makes the network easier to read as a mix of established infrastructure hubs and emerging locations. Monad is not defined by a single country; it is developing through a layered set of markets that can be compared without losing the broader regional picture.
Provider Mix Turns Geography into Actionable Infrastructure Data
What makes Monad Geo especially useful is that it does not stop at geography. The dashboard cross-references region, country, and provider data so users can understand not only where validators are located, but also how infrastructure is distributed inside those locations.
Operator Actions
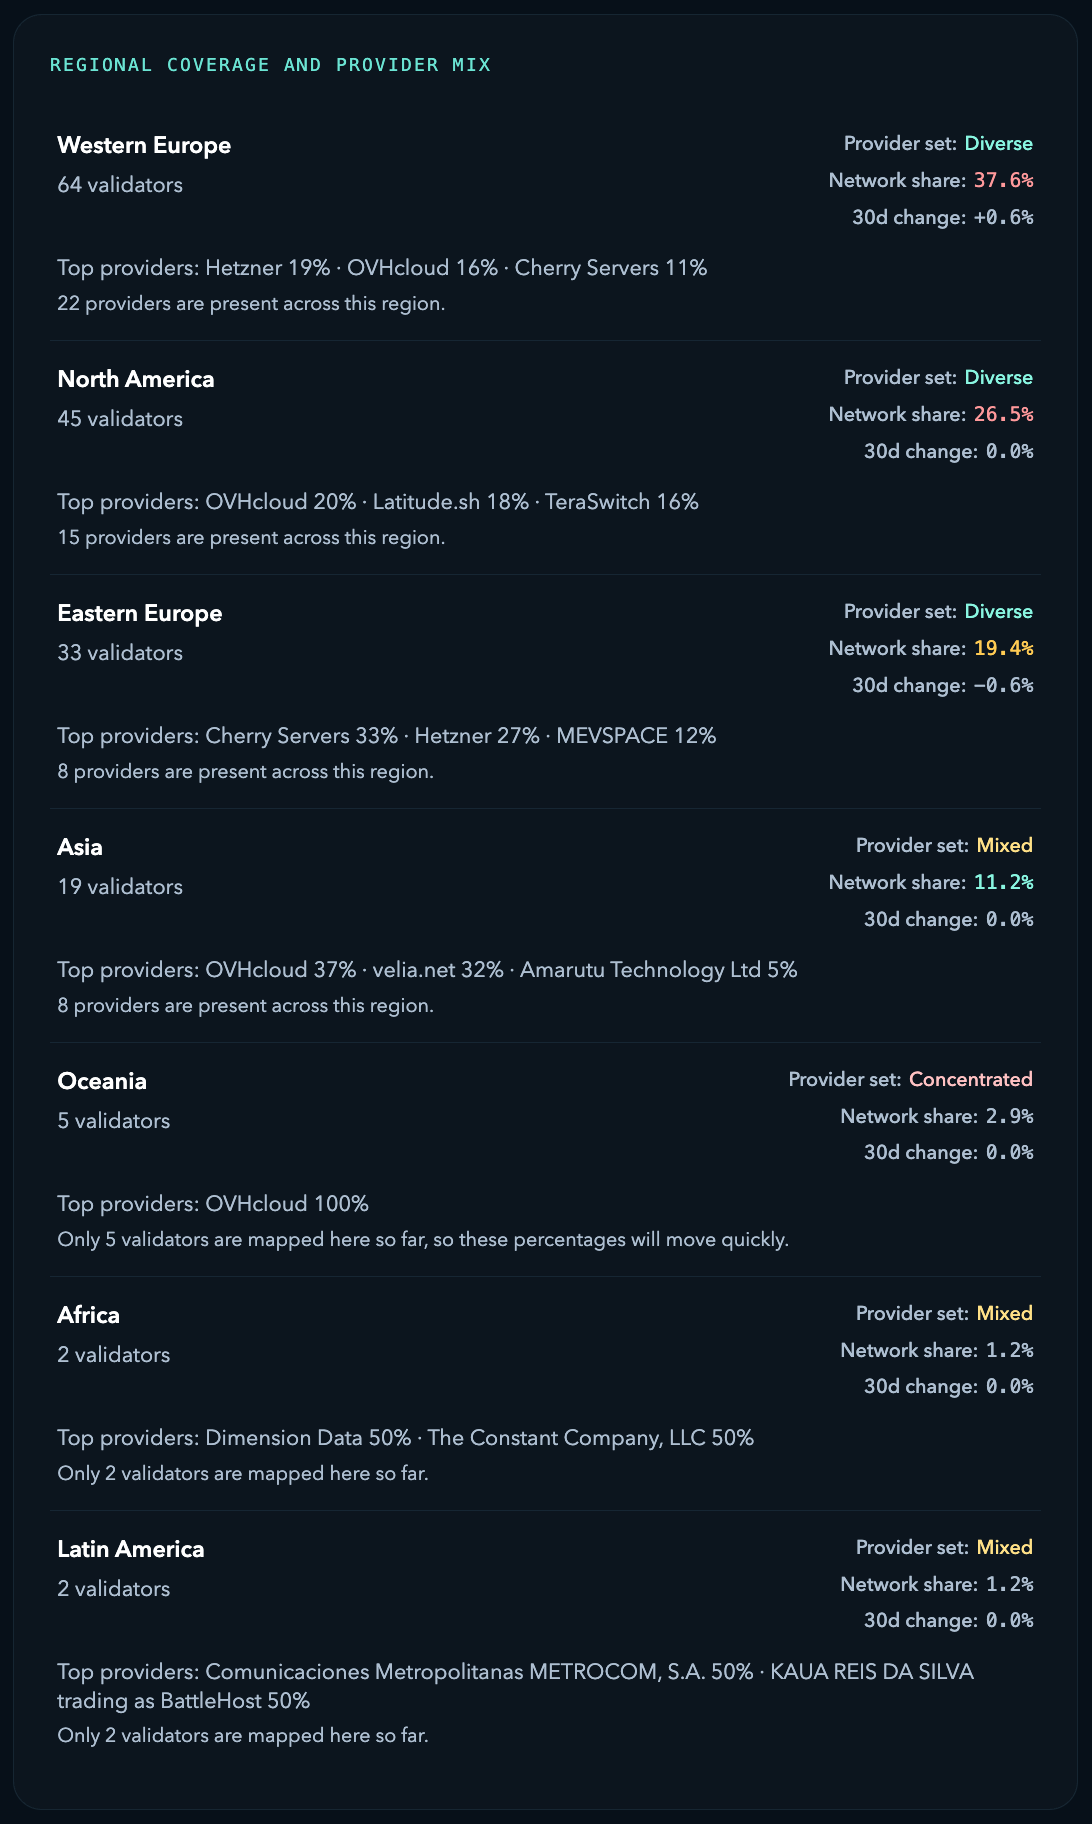
For example, Western Europe pairs scale with breadth, showing 22 providers across the region. Its top providers are Hetzner at 19%, OVHcloud at 16%, and Cherry Servers at 11%. North America also presents a healthy multi-provider profile, with 15 providers led by OVHcloud at 20%, Latitude.sh at 18%, and TeraSwitch at 16%. Eastern Europe stands out as a strong validator region with 33 validators across 8 providers, led by Cherry Servers at 33%, Hetzner at 27%, and MEVSPACE at 12%.
Asia is already meaningful at 19 validators, with a mixed provider profile led by OVHcloud at 37% and velia.net at 32%. Oceania currently shows 5 validators, all mapped to OVHcloud, while Africa and Latin America each show 2 validators split across two providers. These smaller regions are exactly where even modest growth can strengthen the network's global distribution profile quickly.
Why Monad Geo Matters
Risk Watch
Monad Geo helps users ask better questions. Not just how many validators exist, but where validator activity is building strongest, which countries are emerging as critical hubs, how provider diversity behaves inside each region, and where new deployments can add the most strategic value. That matters for operators planning infrastructure, for delegators and researchers assessing decentralization, and for ecosystem teams tracking how the network evolves over time.
The dashboard is built for exploration rather than static display. Users can move from the global map into regions, then into countries, then into provider mix. That connected flow is the point: the most useful insights appear when multiple distribution signals are read together rather than in isolation.
Monad Geo is now live.
Sources
- Monad Geo launches with a live view of 192 total validators, 170 active validators, 26 countries, and 43 providers.
- The dashboard links region, country, and provider mix so users can read infrastructure concentration instead of just raw validator totals.
- Western Europe, North America, and Eastern Europe currently form the strongest mapped validator core, while Asia and smaller regions show visible expansion headroom.
- Monad Geo is built as an interactive analytics layer for operators, delegators, researchers, and ecosystem teams tracking network structure over time.